Configuration
Hardware
For the screen, the connectivity is a standard VGA port. Two ports are available: one is located on the front and another on the rear of the probe.
For the keyboard, you can plug it to any of the four USB ports. Two are located on the front and the other two on the rear side of the probe.
By default, the probes are equipped with four Gigabit Ethernet interfaces labeled 1 to 4. The first one is the administration port used to connect to the probe. Plug the Gb1 network interface to your network to be able to connect to the probe. The three other interfaces, 2 to 4, are dedicated to network traffic sniffing. Connect one or more of these interfaces to your network depending on the network traffic you want to analyze and monitor.
Pulsar
The probes come with a Command Line Interface named Pulsar. This allows the user to check the probe state and configure it when needed.
Connect to the probe
If this is your first encounter with the probe, you will have, for the
first time only, to access to the probe physically (just use a screen
and keyboard plugged to the probe). Log in with user admin and
default password admin. Once the network address of the probe has
been set up, you will be able to access it directly through SSH on
port 22, with the same user admin.
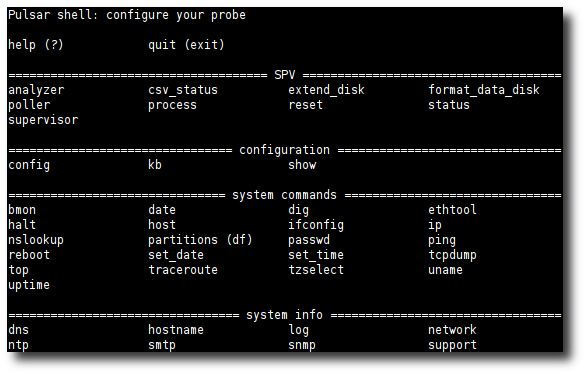
When logged in, you should see the following prompt (version number may vary).

Pulsar prompt on the poseidon probe.
Note
Pulsar uses 3 colors to display informations.
- Green outputs are informational.
- Yellow outputs are warnings.
- Red outputs are errors.
If needed, you can set the keyboard mapping with the kb <mapping>
command. Typing kb displays the list of available mappings.
Pulsar lets you change the administration password through the
passwd command. This should be your first command. Typing
passwd in the Pulsar shell launches the standard UNIX
password-change process.
Warning
At this point, there is no way to retrieve the password. If you lose or forget the password, the SkyLIGHT PVX support team can generate a new one. See Support access through VPN. You can also restore the probe, see Restore probe state.
If your PVX appliance comes with a serial port, a console should also be
available on it since the 4.1 release.
The serial connection should be done at 115200 Bd with 8 data bits, without
parity, with one stop bit and without flow control.
From a Linux or macOS computer, the following GNU Screen command is enough to
connect to the serial console, replace /dev/X with your corresponding
serial port:
screen /dev/X 115200
From a Windows computer, PuTTY could be used.
Configure the probe
Use the config command to set up the probe.
pulsar# config
service:
1. dns
2. hostname
3. network
4. ntp
5. smtp
6. support
7. **all [default]**
Your choice?
Typing enter will launch the whole interactive configuration
process.
Warning
This command is mandatory as it will configure key elements needed for proper operations (DNS servers, hostname, IP address, NTP, SMTP, etc.).
Some changes in configuration require a reboot of the probe
(command: reboot).
Restore probe state
You may need to restore the probe’s original configuration. There are two ways of achieving this. Since these are destructive commands a strong confirmation will be requested.
You may erase data from previous network captures. This preserves configuration settings and GUI user accounts.
pulsar# reset data
...
Stopping services...
Deleting data...
Done.
The command reset all will destroy both your configuration and
capture database. You will have a fresh new database. Configuration
settings, users and captures will be reset to default values.
pulsar# reset all
...
Stopping all services...
Resetting...
Creating default settings...
Done.
Formating data hard drive disks
This is to be used when new data disks are delivered. Any existing data (both capture and configuration data) will be lost. Default values will be restored. A reboot is required to perform this operation.
PVX# format_data_disk
!! WARNING !! You are about to format the data HD. All data will be erased.
Type 'yes!' to confirm, without quotes: yes!
Datadisk marked to be formatted, please reboot now to execute the formatting.
Listing running processes
The process command lists all of the processes running on the
appliance as well as their uptime.
pulsar# process
distribute                       RUNNING   pid 4546, uptime 8 days, 3:56:33
storage                          RUNNING   pid 4547, uptime 8 days, 3:56:33
junkie                           RUNNING   pid 10892, uptime 2 days, 2:39:19
nevrax                           RUNNING   pid 93442, uptime 2 days, 0:54:49
machine-status                   RUNNING   pid 4542, uptime 8 days, 3:56:33
junkie-dumper                    RUNNING   pid 10859, uptime 2 days, 2:39:25
dumptimer                        RUNNING   pid 6206, uptime 2 days, 2:51:35
low-space-watchdog               RUNNING   pid 4544, uptime 8 days, 3:56:33
monitor-nevrax                   RUNNING   pid 130617, uptime 1:57:06
notifications                    RUNNING   pid 355, uptime 2 days, 2:58:51
You can see in this example that some processes have been restarted recently.
The table below provides a brief explanation of the most important processes:
Name Also runs on a capture Role distribute No Deploys configuration and collects CSV files on traffic statistics storage No Stores new data into the RDBMS and handles data aggregation junkie Yes Network sniffer that computes various statistics about the traffic nevrax No Web interface
The followig table references most of our internal processes:
Name Also runs on a capture Role machine-status Yes Gathers statistics about the probe junkie-dumper Yes Part of the sniffer data aggregation process dumptimer Yes Part of the sniffer data aggregation process low-space-watchdog Yes Monitors the available disk space monitor-nevrax No Ensures good resources usage of nevrax notifications Yes Handles the notification system
More about Pulsar
The help command provides both global and command-specific
assistance. Tab-completion is enabled for commands and
subcommands such as help, config and show.
Available commands.
Configuration example
Warning
As of SkyLIGHT PVX 4.1, most of the configuration should always be performed on the Nodes Management page of the web interface since the datastore stores the master configurations of its captures!
Here’s an example of network configuration:
Capture-1# config network
[NETWORK] (type '?' for help)
Interface selection:
  Enter  1 for eth0
  Enter  2 for eth1
  Enter  3 for exit network configuration
Your choice? 1
Which configuration would you like to change on eth0?:
  Enter  1 for up the interface
  Enter  2 for down the interface
  Enter  3 for IPv4
  Enter  4 for IPv6
  Enter  5 for configure another interface
  Enter  6 for exit network configuration
Your choice? 3
How do you want to configure the interface?:
  Enter  1 for disable IPv4
  Enter  2 for static IP
  Enter  3 for IP via DHCP [default]
Your choice? 2
IPv4 address: 192.168.1.1
netmask: 255.255.255.0
gateway (type 'empty' to remove): 192.168.1.254
Which configuration would you like to change on eth0?:
  Enter  1 for up the interface
  Enter  2 for down the interface
  Enter  3 for IPv4
  Enter  4 for IPv6
  Enter  5 for configure another interface
  Enter  6 for exit network configuration
Your choice? 6

Configuration summary
[NETWORK]
eth0 (up)
  IPv4
    mode        : dhcp --> static
    address     : None --> 192.168.1.1
    netmask     : None --> 255.255.255.0
    gateway     : None --> 192.168.1.254
  IPv6
    mode        : auto

Capture-1 (uncommitted changes)# commit
System configuration changes have been committed successfully.
Successfully applied the changes to the system.
Network changes will not be effective until next probe reboot.
Reboot now?:
  Enter  1 for yes
  Enter  2 for no [default]
Your choice? 1
Pulsar is going to reboot the machine...
Support access through VPN
The probes come with an already configured VPN connection to allow
access for support operations, if needed. The VPN address is set by
default and should normally not be changed. If you need to,
you can change it with the config support command in Pulsar.
The VPN service is stopped by default. You can start or stop it at
any given moment using the corresponding support start or
support stop commands in the Pulsar shell.
Note
For the VPN connection of the probe to work properly, you
will probably have to configure your network and/or security
equipment, including your firewalls. Default DNS Host is
vpn.performancevision.com and default port is 443.
Support with no remote access
In case the probe is not accessible from the Internet, you can use
the diag command. It’ll generate a tarball containing all
necessary information for the support team to do diagnostics. Once
the tarball is generated, you’ll have to download the file using FTP
with the classical admin account (in the /diag directory) and send it
to the support team by email or any file sharing platform (file size
can be huge).
probe# diag
Creating a diagnostic package, could be long...
Download the diagnostic file with a FTP client: DIAG-E2A346A2-55F7-5834-40AE-B1EC5967FB61-20140610131029
What information to give to the support team
Use the info command. This summarizes all the basic information
needed for support assistance, such as state of the probe, IP address
of support tunnel and other useful data.
probe# info
UUID                           E2A346A2-55F7-5834-40AE-B1EC5967FB61
Platform                       vmware
Role                           Datastore
Release                        3.0.9-r1-internal
License                        Valid license (2015-01-02 00:00:00)
/ usage                        42%
Datadisk present?              True
/srv usage                     27%
Admin interface                192.168.80.119 / 255.255.255.0 - 192.168.80.255
Support interface              10.10.0.5 / 255.255.255.0
Sniffer state                  RUNNING
Distribute state               RUNNING
Storage state                  RUNNING
GUI state                      RUNNING
Database state                 RUNNING
How to configure User Interface language
The User Interface is available both in English and French. The language is automatically detected, based on the default language of the browser used to access the probe. So, to make the user interface use the desired language, the administrator should check and configure the default language of the browser.
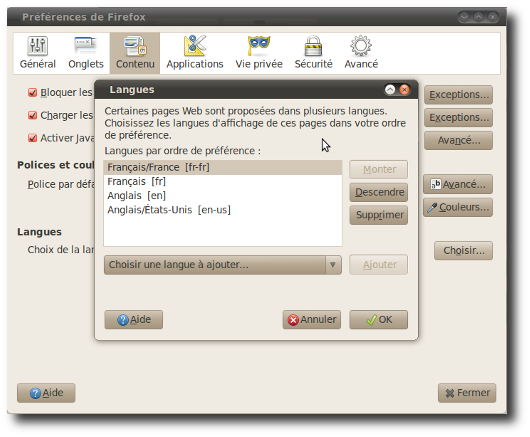
Configuration of the French language in Firefox.
PVX Functional Configuration
User Management
There are two groups of users in the ”Users Configuration” interface:
- The Administrators group
- The Users group
These two groups have different access permissions to the application pages: the Administrators group provides its members full access to the “Configuration” pages. Users group members will be able to read reports but will not have access to the “Configuration” pages.
In order to create a new user account, you must be logged into the
appliance as a member of the Administrators group. As mentioned in
the previous paragraph, the default Administrators group has the
right to create, modify and access the configuration. You can add a
new user account by clicking on the Users tab found on the
configuration menu. Then click on the Add button and fill in the
“User information” (username, password, and group). Make sure the
Active button is checked; otherwise, the user won’t be able to
log in. This option allows you to disable or enable an account
without deleting it.
.
. container:: example
Example: Adding a new member toAdministratorsgroup. Below, we have created an administrator user account withJohnas the user name andfoo2as the password:
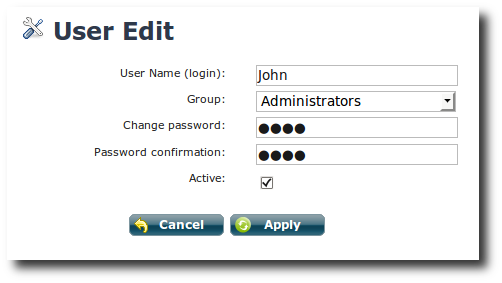
Edit User.
The user name is case sensitive, and it is required to be non-empty
and to contain only letters, numbers, or _ (underscores).
You can modify a user account by clicking on the Users tab found
on the configuration menu. Click on the user name of the desired user
account in the list of users. You will be able to modify any field.
To protect information, the password field will appear empty during
edition and will not be modified it left empty. To save your changes,
click on the Apply button.
You can delete a user account by clicking on the Users tab found
in the configuration menu, and then clicking on the check box next to
the user name of the account you wish to delete. Click Delete to
remove all selected users.
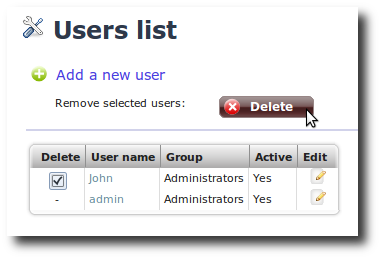
User account ‘John’ is about to be deleted.
Zone configuration
The aim of this chapter is to help the administrator of the platform to configure zones. When you change or create a zone, the modifications will be effective immediately for future integrations. It will not affect already captured data which keep their old zone attribute.
How to access the configuration menu
After clicking on the top right Configuration button, you will
observe a tree configuration menu with different items.
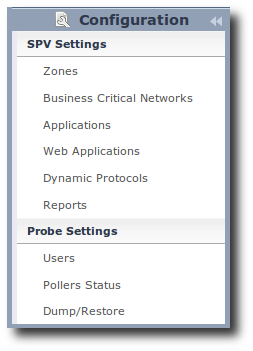
Configuration menu.
Zones management using the GUI
Pleaser refer to Zones for Zone tree and Fallback explanations.
You can reach the zone configuration page by clicking on the Zones
label of the menu. The illustration below lists the zones and
their corresponding definitions.
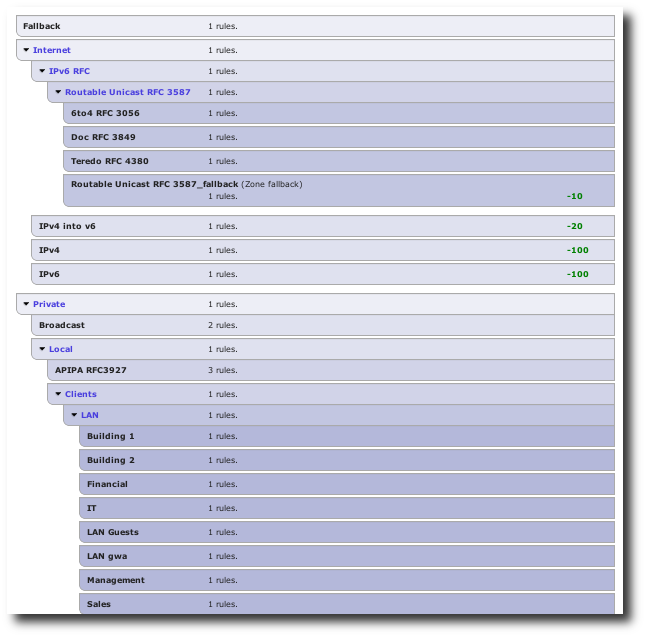
Overview of the zone tree editor
This page allows you to add a zone, edit a zone, move some zones around or delete a zone.
In order to edit a zone or add a new child, you need to click on the zone block to expand it. All of its filters will then be available for edition.
Each filter is composed of a subnet field, a MAC address field, a VLAN field, and device and capture select boxes. Any of these filters can be left blank, in which case no tests are performed on the corresponding value. When several fields are set, all must match simultaneously for a conversation to be associated with this zone (in other words, the filters are logically ANDed together).
Here are some examples of IP matches using classical CIDR notation:
192.168.100.0/24192.168.100.12/32192.168.100.12(equivalent to192.168.100.12/32)::ffff:192.168.0.0/128
The matches also support extended mask:
192.168.*.25192.168.0.25/255.255.0.255(same as above)
Likewise, here are some examples of MAC addresses matches:
32:43:a0:00:00:0132:43:a0:00:00:01/20
The extended matches are also supported for MAC addresses:
32:43:*:00:00:0132:43:00:00:00:01/ff:ff:00:ff:ff:ff(same as above)
Finally, the numeric priority field allows to alter the default priority; higher priorities are tested before lower priorities. Note that priorities can be negative values as well as positive values.
Application configuration
You can configure Applications in the Configuration page.
Applications represent the business applications running on your
network and make the reports easily understandable to everyone in your
organization.
To access the configuration of Applications, click on the
Configuration button on the top right of the user interface.
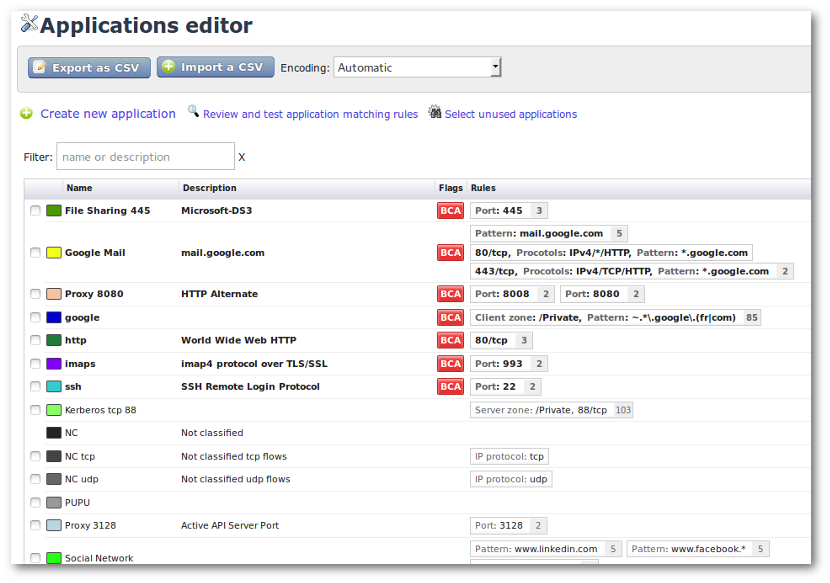
Application list screen.
This panel displays the existing Applications (default or
user-defined applications). To create an Application, click on
Create new application; you will see the configuration screen.
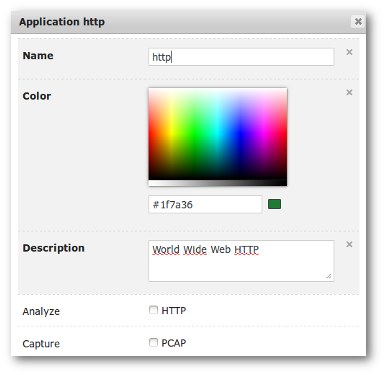
Application configuration screen.
An Application can be defined using the following elements:
- Name: the designation of the Application which will be used in displays. This is a mandatory field.
- Color: the color which will be used to display this specific Application in graphs. This is a mandatory field.
- Description: a description field which should be used to track information related to this Application.
- BCA/HTTP/PCAP flags: to mark this application as Business Critical, as requiring HTTP analysis and/or automatic traffic capture.
You can attach as many rules to an application using the Add rule
button. A flow that matches these rules will be associated with this
application. A rule can test any combination of:
- IP Protocol: to select a given IP protocol (such as ‘TCP’ or ‘UDP’). This accepts the same syntax as in Zone configuration.
- Application Port Range: single port or port range.
- Client and Server IP Address: IP addresses (or ranges) of the clients and servers of this application.
- Client and Server Zone: zone in which the clients and servers are located (see Types of Conversations for details on client/server identification).
- Protocol Stack: allow to select only those flows identified by the sniffer as featuring this protocol stack (use with caution).
- Capture: to filter on a single capture probe.
- Device Identifier: to filter on a single network adapter.
- VLAN: to select flows from a given Ethernet VLAN tag or range.
- Ethernet Protocol: to filter on a given Ethernet protocol.
- Client and Server Ethernet Address: MAC addresses of the clients and servers of this application. This accepts the same syntax than the zone configuration.
- Web Application Pattern: allow to select those HTTP messages concerning only a given URL pattern.
Web Application Pattern
The web application pattern in an application rule is used to specifically identify HTTP applications. They are defined as patterns matched against the URLs contained in HTTP requests. The patterns should contain at least a domain name, optionally including wild card characters like ‘*’ or if you check ‘regex mode’, you can set PCRE regular expressions.
Notice that in a typical conversation, several HTTP messages referring to several URLs will be present. The application rule will only be checked against the first encountered URL per socket. This is not a problem if all URLs in a given socket follow the same pattern (which is usually the case provided your pattern is not too picky).
Business Critical Applications
Any application can be tagged as Business Critical. Those applications are used to display the ‘Business Critical Application Dashboard’. To flag a given application as critical (or to remove this flag), edit this application by clicking on it in the application list and toggle the Critical Application checkbox.
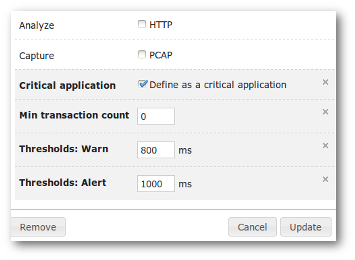
Business critical application edition
When you flag an application as Critical, three additional parameters are requested:
- The minimum transaction count. It indicates, for one minute, the minimum of SRT (Server Response Time) events to be seen on the network for being considered as a pertinent measurement. If no transaction at all is seen during the period of time analyzed, the color displayed on the BCA dashboard will be “white”. If the number of events seen during the period of time analyzed is above zero but under this value, the color displayed on the BCA dashboard will be “grey”. It means that some events have been seen, but not enough to be considered as a pertinent measurement. If the number of events seen during the period of time analyzed is above or equal to this value, the color displayed on the BCA dashboard will be either “green”, “orange” or “red” depending on the EURT values.
- The warning threshold level of the EURT (End User Response Time) value in milliseconds. When the value is above or equal to this level, the color displayed on the BCA dashboard will be “orange”. When the value is under this level, the color displayed on the BCA dashboard will be “green”.
- The alert threshold level of the EURT value in milliseconds. When the value is above or equal to this level, the color displayed on the BCA dashboard will be “red”.
Note
To be useful and pertinent, these parameters must be accurate values adjusted to your network configuration. These values can be easily changed for fine-tuning or to cope with any change in the network or applications you are using.
A new critical application will get the benefit of all the data history. After having defined an application as critical and data has already been collected for this application then the thresholds will be automatically applied on the BCA dashboard, even for a period back in time.
Business Critical Networks
A BCN consists of a virtual link between two zones; its objective is
to monitor normal volume and performance levels between two network
segments, which represent a strategic network link for your
organization (e.g., link from the data center to a remote site, from
the server VLAN to a user VLAN). An administrator can configure
thresholds for warning and alert on bandwidth consumption,
Retransmission Rate (RR) and Round Trip Times (RTT).
A specific configuration screen allows configuring the specified BCN. To access it, just go to the Configuration menu and choose the entry labeled Business Critical Networks.
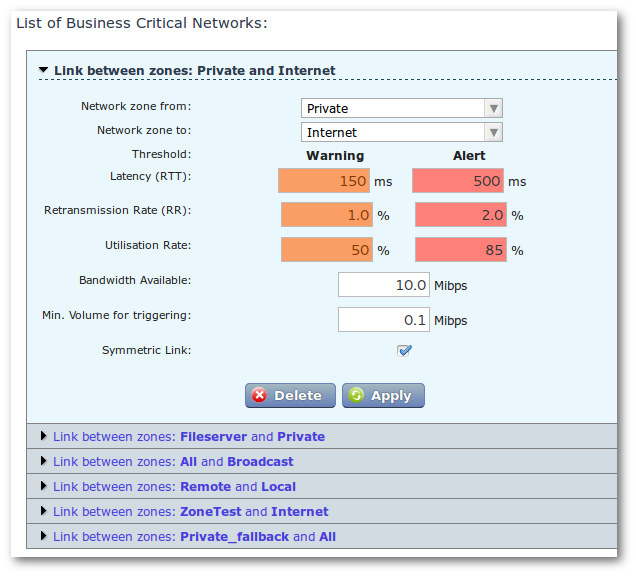
Editing an existing Business Critical Network
From here you can add a new BCN or edit the parameters of an existing BCN. Modifications will also be applied on already captured traffic.
For each Critical Network, you have to configure the following parameters:
The source/destination network zones.
One or several thresholds for both
WarningandAlertlevels, all these thresholds are computed from source to destination and not from client to server. We call this an “oriented” metric:- Oriented latency (RTT in ms)
- Oriented retransmission rate
(%) - Utilization rate
(%)according to bandwidth available(Mib/s)
A minimum volume for triggering
(Mib/s). This value represents the minimum bandwidth observed from which you will consider the performance and volume thresholds as relevant.The thresholds values can be configured as symmetric by ticking the
Symmetric Linkcheck-box or be configured as distinct values for both directions. This is particularly useful when the critical network:- refers to asymmetric connections like ADSL,
- has one of its zones closer to the capture than the other
zone and latency
(RTT)computation is impacted (see Distributed Architecture).
You can define thresholds from either one criterion or more (any of the following: latency, retransmission rate and consumption level). But you cannot define a BCN from one zone to itself, as their intended purpose is to check the performance of the most important links or routes between two network segments.
By applying your changes, the BCN Dashboard will be updated in accordance with the new threshold values (including already captured data). To be useful and pertinent, these parameters must be accurate values adjusted to your network configuration. These values can be easily changed for fine-tuning or to cope with any change in the network or applications you are using.
Reports
Creating Reports is just a matter of a few clicks. You can easily create and define exactly the level of information you want to get. You will receive it directly in your mailbox or via FTP at the frequency you prefer.
Configuration
You start by creating a template that will mainly define the name of the report, the list of recipients, a description and the scheduling settings. In the second step you just have to add the different views you want to see applied to the appropriate template. Then you’re done, just check your mailbox.
To create a report template, in the Configuration area, select
Reports in the menu list on the left. This will display the list
of existing report templates. Use the button Create to create a
new report template. Please note that this feature is only available
for users with administration rights.
Create a new report.
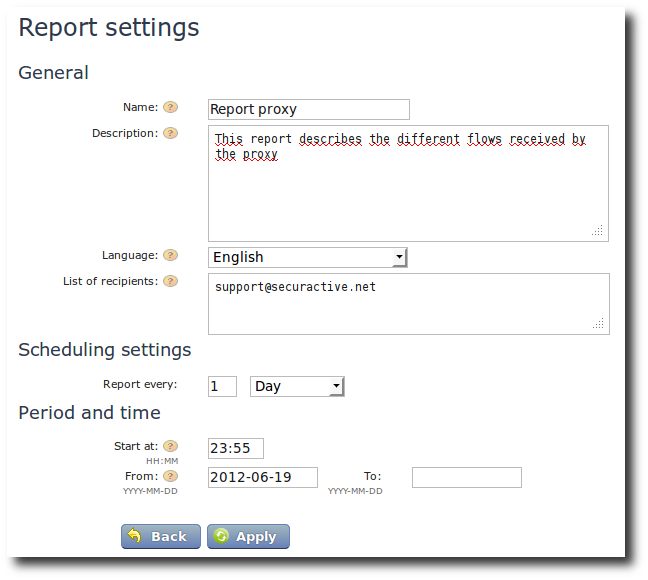
To create a report template, you must provide some information:
- The name of the report for easy identification,
- The full description of this report which will be copied in the PDF file generated.
- The language that will be used for this reports (thus the language for the report can be different than the language of the web screen),
- The list of recipients’ email addresses to which the report will be sent, separated by a comma, a semi-colon or a new line,
- The frequency at which the report will be sent. Available options
are:
Day: Generates the report every x day(s); example: every two days.Week: Generates the report every x week(s) the selected days; example: every two weeks on Friday (several days in the week can be chosen).Month: Generates the report every x month(s) on y day; example: every month, the first of the month (be careful if you choose the day29,30or31, you will only receive your reports if there is such day in the corresponding month).
Start atdefines the hour (formatHH:MM) at which the generation of the report will start. Once the report is generated, it will be sent to the recipients email addresses.FromandTofields are optional. This allows you to define a validity period for the report. In such case, the report will only be sent in the period ranging from the first date up to the second date.
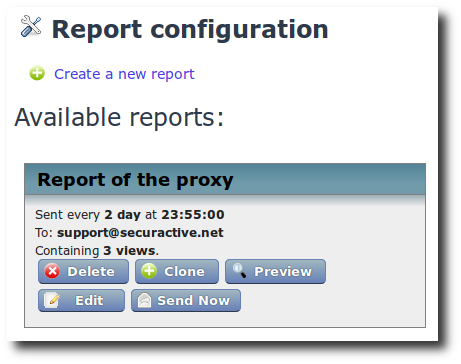
Report: A template just created.
The newly-created report template will appear in the list of available
report templates. A summary is displayed (scheduling frequency,
generation time, first recipient emails). At this stage, it is empty
and does not contain any view; this is why you have
Containing 0 views indicated. If views have been added, it will
be indicated accordinly.
Add views to report
To add a view to a report template, just go to the screen with the
desired view. Select a time period and run the search. Once search is
completed, the link Add this page to a report becomes active. When
you click on it, a drop box with the list of available template
reports is displayed. You can chose the template report to which you
want to add the current view and click on the button Add. If you
need, you can click on Show report list, it will open the
configuration area with the list of available report templates.
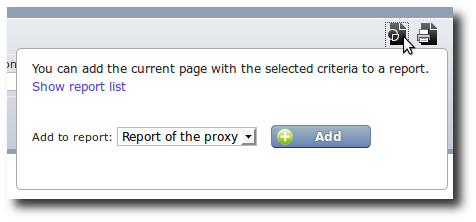
Add a view to a report template.
Please note that while the time is fixed, the date will remain
relative to the moment the report is sent. If the view you’re adding
starts yesterday at 20:00 and ends today at 8:00, and the
report is scheduled to be sent next Friday, then the effective capture
time bracket will be from Thursday at 20:00 to Friday at 8:00.
Once the page is added to a report, you can modify the filters with
the Edit button. For each page, you may add an optional
description to explain its purpose.
Note
Before release 2.9, an additional time delta was added under certain circumstances. As of 2.9, this is no longer the case; all dates are relative to the day the report is being sent.
Actions on reports
A report template can be deleted using the Delete button. You can
clone a report template: all its parameters and included views will be
duplicated. A new report template is created, with (copy) appended
to the report name.
Preview will start the generation of the report right now and you
will be able to see the PDF file with your favorite PDF viewer once it
has been generated. Notice that the generated report will query the
same time intervals as the next scheduled report. This can lead to
some blank pages if the data for these intervals were not yet
collected.
Edit allows you to change the parameters of the report template
(name of the report, the list of recipients and the scheduling
settings).
Send now will start the generation of the report right now and the
report will be sent by mail once it has been generated. Again, the
report will query the same time interval as the next scheduled report.
Sending email
So that your reports could be sent properly to the recipients email
addresses, you need to configure the SMTP server within
Pulsar. You can do that with the config smtp command. Then
just add a valid SMTP host, and an optional login and password
in case you use an authenticated SMTP server. You also can modify
(with the same command) the From header of the emails generated
by the probe.
After that, you can either reboot the probe or use smtp stop
followed by smtp start commands to activate the new configuration.
Degradation
This configuration page allows you to change how and when the aggregation system will merge the data. The merging process is done per metric, and there are three configuration options:
mid-termview degradationlong-termview degradation- no degradation at all
Mid-term and long-term views correspond to the less
fine-grained data (1 hour and 1 day data-granularity,
respectively). For a detailed explanation of the aggregation levels,
refer to the Aggregation section. The default
configuration balances retention of important informations and disk
usage.
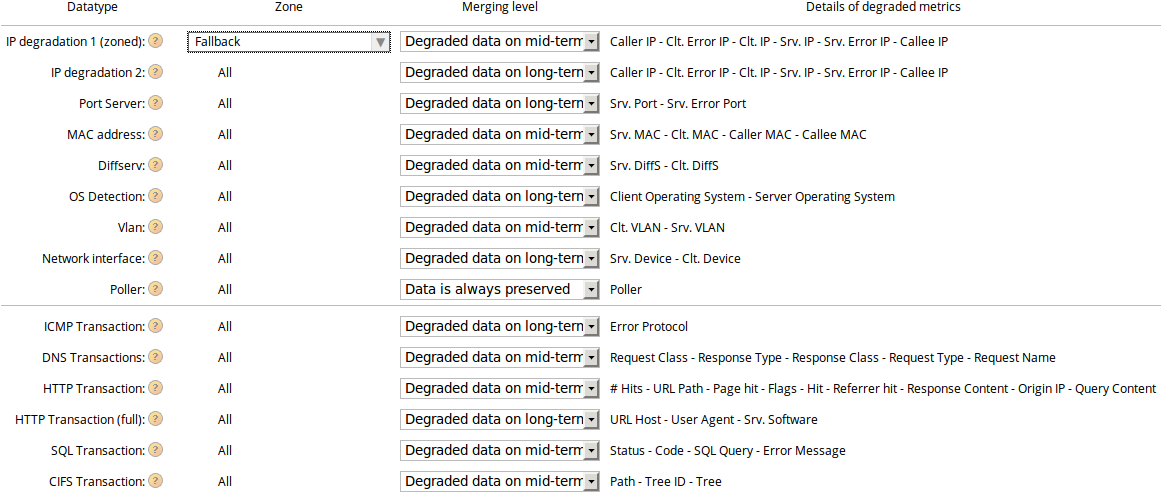
The degradation configuration page
IP degradation is specific as it is done in two steps. The first one
is zoned where you are supposed to set your Internet zone or
equivalent. The second step is degradation of all IP addresses.
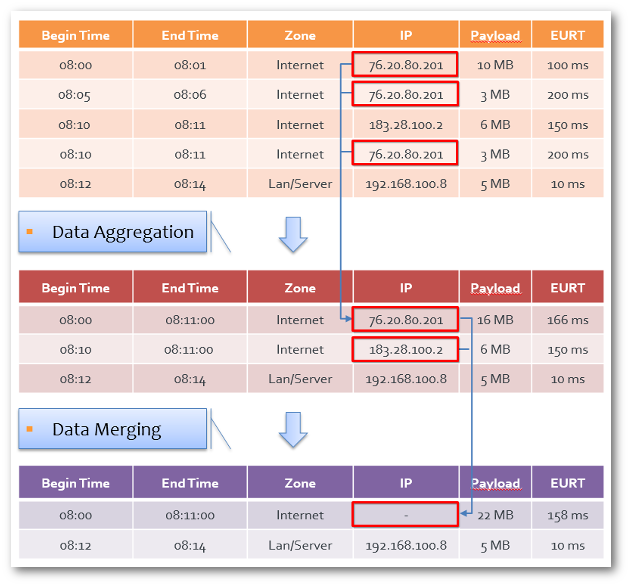
IP aggregation, then degradation
Note
Due to their impact on disk usage, client ports and captured PCAP files are always degraded at the second aggregation level.
Please note that the degradation settings of some metrics are not configurable due to their strong storage requirements due to their huge variability:
| Metric | Degradation level |
|---|---|
| client port (from a TCP or UDP packet) | mid-term |
| client error port (from a TCP or UDP packet embedded in an ICMP packet) | mid-term |
| PCAP (associated file) | mid-term |
SNMP
Configuration
SNMP requests are answered on the default SNMP port.
The SNMP objects that are made available are twofold: standard SNMP
objects and PVX-specific objects. Version 2c of the protocol is supported.
Activation
Configuration > Settings > Nodes Management
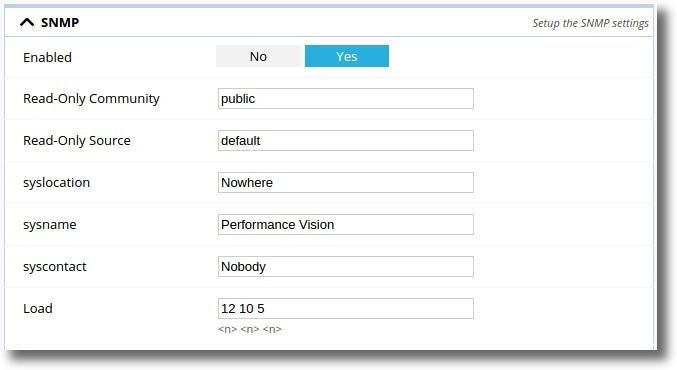
SNMP Configuration by GUI.
Set SNMP Enabled to Yes and apply configuration
Others options
- Read-Only Community: SNMP community, default value public
- Read-Only Source: authorised ip address, default value default, valid example 10.10.1.0/24
- syslocation: syslocation field of the MIB, valid example Datacenter
- sysname: sysname field of the MIB, valid example Datastore
- syscontact: syscontact field of the MIB, valid example admin@mycompany.fr
- Load: Alarm fields for excessive load of the system, respectively 1, 5, and 15-minute load averages. default values are 12 10 5. Please note that these field are relative to UCD-SNMP-MIB.latable (http://www.net-snmp.org/docs/mibs/UCD-SNMP-MIB.txt)
Once enabled, you’ll be able to request system linux SNMP or SkyLIGHT PVX OIDs. Contrary to pre-4.1 versions, the entire SNMP stack is started when enabled.
BCA/BCN SNMP requesting
Some data coming from BCA/BCN dashboards are available in the SkyLIGHT PVX MIB.
The result you get when requesting SNMP BCA/BCN is for the actual time - 10 min.
- Example:
SNMP request made at Aug 10 11:31:09 (1470821469 EPOCH format)
- Request result sample:
- BCA name = YourCriticalApp
- BCA data = EURT
- BCA TS = 1470820869 -> Aug 10 11:21:09
In other words, the BCA/BCN results you get are always 10 minutes old.
Note
You’ll find these informations described in the
MIB itself;
take a look at the bcaStateTable and bcnStateTable tables
for more details.
MIB
Note
- The PVX enterprises MIB part has been updated in v4.1. Overall,
the MIB has been cleaned of useless items, and the
Business Critical Network/Applicationparts have been fixed and updated. - Note that obsoleted fields have been kept for compatibility reasons.
The probe uses the UNIX Net-SNMP [2] daemon, which serves
standard MIB, so you can monitor your probe from your SNMP console
as you would normally monitor any UNIX server. For instance, the usual
statistics on network interface usage, file system available spaces,
I/O operations, etc. are available.
In addition to these default information, the probe provides various
statistics under
iso.org.dod.internet.private.enterprises.performanceVisionSA
(1.3.6.1.4.1.36773).
The SkyLIGHT PVX MIB file is available
here.
| [2] | http://www.net-snmp.org |
Note
You can also check the related page SNMP modifications in version 4.1.
TLS Decryption
Some of the protocols inspected by PVX may be encrypted using TLS, namely: HTTP, SKINNY or SIP. Under some conditions, PVX can decrypt these streams and proceed with inspection as normal. In other words, it is possible to visualize HTTPS transactions.
To activate this feature, you must fulfill all of the following requirements:
Have access to the private keys of the targeted servers and upload them into PVX. Please bear in mind that anyone with your private key can do the same as the PVX probe, so make sure you upload it using HTTPS and secure access to the probe file system.
Force the server (or the client) to use these keys to encrypt the handshake (in other words, disable those encryption algorithms such as Diffie-Hellman). For instance, for the Apache web server, make use of the SSLCipherSuite parameter. Here we only allow the Cipher Suite using RSA key exchange algorithm:
SSLCipherSuite kRSA
Force the servers or clients to forget about previous TLS sessions (or wait long enough, typically some hours). PVX will do its best to remember new TLS sessions but will dedicate only a limited amount of memory to do so. Also, memorized sessions are not written to disk and will not survive a sniffer restart.
Make sure the probe receives 100% of the traffic to/from targeted servers as decryption cannot work around missing packets.
Make sure required resources are available since decryption is CPU-intensive.
Note
Here’s the list of supported cipher suites:
TLS_RSA_WITH_RC4_128_MD5
TLS_RSA_WITH_RC4_128_SHA
TLS_RSA_WITH_DES_CBC_SHA
TLS_RSA_WITH_3DES_EDE_CBC_SHA
TLS_RSA_WITH_AES_128_CBC_SHA
TLS_RSA_WITH_AES_128_CBC_SHA256
TLS_RSA_WITH_AES_256_CBC_SHA
TLS_RSA_WITH_AES_256_CBC_SHA256
TLS_RSA_WITH_CAMELLIA_128_CBC_SHA
TLS_RSA_WITH_CAMELLIA_128_CBC_SHA256
TLS_RSA_WITH_CAMELLIA_256_CBC_SHA
TLS_RSA_WITH_CAMELLIA_256_CBC_SHA256
TLS_RSA_WITH_SEED_CBC_SHA
Note
The private key should not be encrypted.
You can check this with a text editor.
Here is what you see in the case of an encrypted private key file encrypted-privkey.pem:
-----BEGIN RSA PRIVATE KEY-----
Proc-Type: 4,ENCRYPTED
DEK-Info: AES-128-CBC,9FDE041BAEF12A0AE504E777B6DEFE6A

s9uSwXkm9nUp7JKAgjAXaKtP6vJyPmITQ4Ajf7p+EA/V56sdM7c1g18VneEpVjOJ
.
.
.
siQa1asZVSb1u1EB1SeGi0/jBeYxDezpAMx93Q1GLaudolppeUn7jt8Ks0Ie7dXj
-----END RSA PRIVATE KEY-----
Note the keyword ENCRYPTED.
To decrypt this encrypted private key, you can use the openssl utility as follow:
openssl rsa -in encrypted-privkey.pem -out decrypted-privkey.pem
Enter pass phrase for encrypted-privkey.pem:
writing RSA key
Here is the excerpt of the decrypted private key file decrypted-privkey.pem:
-----BEGIN RSA PRIVATE KEY-----
MIIJKQIBAAKCAgEA2nU/WH9vswkuTZ1yKLUGgeX9G/6uKoqdhGT/aBpGq1ADyWh4
.
.
.
DsCzxTio9hREPjDxGbR9K1RuTMVEN6Q+Ng3haNiMSZT7IykWzX6M2Khvi+D2
-----END RSA PRIVATE KEY-----
This private key file can be uploaded in PVX.
Changing a capture’s IP
If a capture’s administrative IP has been changed, either from its configuration or as a follow-up to an external event (for example the DHCP server has released the node’s lease), the datastore has to be notified of the modification.
Overview
In this example, two nodes are available: a datastore and its capture with IP 192.168.10.153.
From the datastore, Pulsar will show all of the managed nodes with the
capture command:
datastore# capture
Name:            datastore (ACTIVE)
Address:         localhost
Device ID:       CE5C344B-76E8-A444-AD75-F8428244E417
...

Name:            capture (ACTIVE)
Address:         192.168.10.153
Device ID:       4FFDB07D-E4D0-8E4D-95B6-FB96C3CA3288
...
Or go to the Configuration > Settings > Nodes Management page to get an overview:

Modifying the administrative IP
In this example, the administrative ethernet card is statically configured. The IPv4 address has to be changed from 192.168.10.153 to 192.168.10.154. This operation is done via the Nodes Management page, by editing the capture’s eth0 administrative interface:
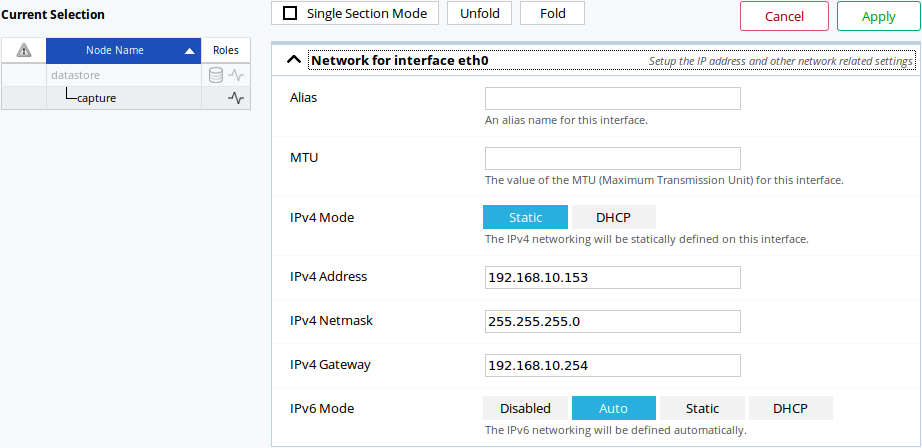
The Nodes Management section allowing the configuration of a node’s interfaces.
Once the configuration has been applied, it will be propagated to the capture. The capture will notify you of any major configuration change with a pending reboot.

By hovering your cursor over the reboot button, you should see the reason.
Proceed to the reboot of the capture:
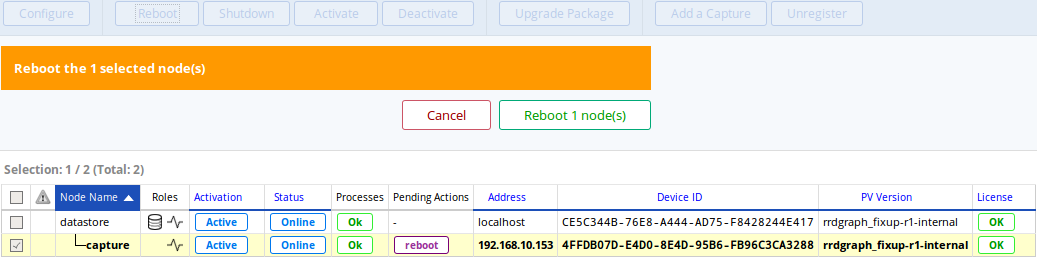
Rebooting the capture to apply network changes.
If the capture has an IP assigned from a DHCP server, the above steps are optional: simply reconfigure your DHCP server and the capture will appear as unreachable.

After a couple of minutes, the node should appear in the offline state. The reboot status will be cleared once the capture has been successfully rebooted and contacted.
From the capture, use the info command on Pulsar to display general
informations.
The administrative IP will be displayed, which should now be 192.168.10.154:
capture (managed config)# info
UUID                           4FFDB07D-E4D0-8E4D-95B6-FB96C3CA3288
Admin interface                192.168.10.154 / 255.255.255.0 - 192.168.10.255
...
Confirming the newly assigned administrative IP
As the administrative IP configuration has been changed, the datastore won’t be able to reach the capture. To correct the datastore’s connection settings for this capture, there are two ways.
From Pulsar, use the capture modify command, which will prompt you for
the new IP.
datastore# capture modify 192.168.10.153
Please enter a new address [192.168.10.153]: 192.168.10.154
Capture 192.168.10.154 updated
From the web interface, the capture’s edition page has a Connection section which allow you to update the administrative IP that the datastore will use.
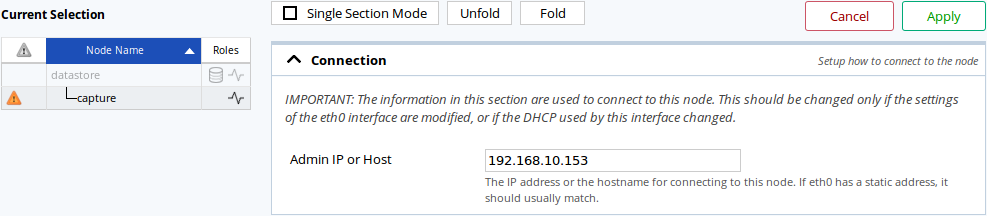
Changing a capture’s IP on the Nodes Management page.
After a couple of minutes, the capture’s status should be marked as online.
