Main terms and concepts
Zones
Principles
A zone is an arbitrary container in which groups of peers can be kept and organized according to their network address.
Each peer being attributed a zone, a conversation between two peers comes with two zones: a client and a server zone.
A zone consists merely of a name, a priority and a set of optional filters. Each conversation is tagged with a client and server zone (using the client and server IP and MAC addresses) according to this process: every rule is tried in order of priority, and the first zone that has filters that comply with this conversation is selected. Thus, it may be important to consider the priority of a zone in the rare occurrence where the default ordering scheme does not yield the expected results.
For instance, here is a simple configuration (in order of priority):
| Priority | Name | Subnet | MAC | VLAN | Capture | Device |
|---|---|---|---|---|---|---|
| 20 | /LAN/Servers/Mail | 192.168.1.25 | 120 | localhost | ||
| 20 | /LAN/Servers/Web | 192.168.1.80 | 120 | localhost | ||
| 10 | /LAN/Servers/Fallback | 192.168.1.1-192.168.1.100 | 120 | localhost | ||
| 0 | /LAN/Fallback | 192.168.1.0/24 | 120 | localhost | ||
| 0 | /Remote | capture2 | ||||
| -1000 | /Internet |
Here, we have two servers (for mail and web) that are tested first by
IP (if the VLAN is 120 and the capture is localhost), then all other
servers (using an IP range), then the LAN, then the remote site
(everything from capture2), and everything else in Internet.
Notice that some fields are unused (MAC, Device), meaning any value will do.
Whatever changes are made in the zone tree, a global fallback (here,
it’s /Internet) will be created by default to store any
conversation that is not matched by any rule (this remains true even
after filters are added for this zone). Also, this zone is special in
that the IP addresses of these conversations will be degraded over
time to reduce storage requirements.
Your actual configuration will, of course, be much more complex. Indeed, even the default configuration is larger:
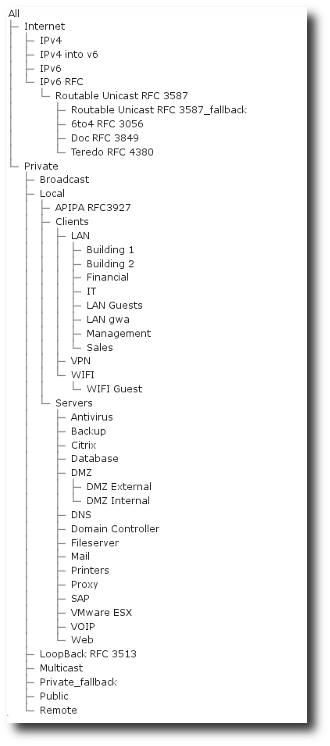
Zone tree as displayed in PVX select boxes, showing the default configuration.
Selections
Zone names, although not used in the aforementioned process, play an important role in the GUI. As you can see on the example, zone names are organised in a tree of sub-names delimited with slashes (/), not unlike a standard file system.
For instance, /LAN/Servers/Web is made of three components, meant to be read
as the host Web, amidst the Servers in the LAN. Here /LAN is said to
be the parent zone of /LAN/Servers and /LAN/Fallback, and /LAN/Servers is
said to be the parent zone of /LAN/Servers/Mail and /LAN/Servers/Web.
In all select boxes of the GUI, selecting a parent zone will select all conversations that fall in this zone or in any of its child zone.
For instance, in the above example, selecting /LAN/Servers will select all
conversations in /LAN/Servers/Mail, /LAN/Servers/Web and
/LAN/Servers/Fallback.
Fallbacks
By convention, a fallback is a zone with a larger filter
but lower priority than a set of more specific rules. For instance, in the
above example, the /LAN/Servers/Fallback zone collects all IP addresses in
the 192.168.1.0/24 subnet after some more precise zones tried to match with
subsets of this subnet.
Notice that the priority of the fallback must be lower than the priority of these smaller zones; otherwise, they would be shadowed by the fallback.
Notice also that if the example configuration was instead:
| Priority | Name | Subnet | MAC | VLan | Capture | Device |
|---|---|---|---|---|---|---|
| 20 | /LAN/Servers/Mail | 192.168.1.25 | 120 | localhost | ||
| 20 | /LAN/Servers/Web | 192.168.1.80 | 120 | localhost | ||
| 10 | /LAN/Servers | 192.168.1.1-192.168.1.100 | 120 | localhost |
i.e., with /LAN/Servers instead of /LAN/Servers/Fallback, then selecting the
/LAN/Servers zone in the GUI would actually select /LAN/Servers/Mail and
/LAN/Servers/Web in addition to the fallback. In other words, there would be
no way to select in the GUI only the peers that are in the servers IP range but
that are neither the mail nor the web server. Using the Fallback naming
convention allow one to select either a specific server (/LAN/Servers/Mail,
/LAN/Servers/Web), all servers (/LAN/Servers) or only the other servers
than mail and web (/LAN/Servers/Fallback).
Application
The main objective of application is to easily categorize network usage. Through this concept, which is a key notion of SkyLIGHT PVX, the administrator can group similar network usages into categories that will make sense for his network context. Additionally, by configuring Applications, reports on network traffic are made clearer and are readable by any user regardless of their understanding of the underlying infrastructure (IP addresses and subnet, or ports used by each application).
An application is a set of network services which together
correspond to a business application. For example, an application
named ERP could be configured to match network traffic on port
TCP/80 on a server Zone containing the specific server
192.168.20.4/32.
Application definition
An application can be defined using a set of filters a flow must match to enter the application. These filters can use various elements of a flow, from its IP addresses to its ports, capture, protocols, and so on.
Notice that depending on what flow is considered, some of the information may not be available. For instance, the attribution of an application for a NetFlow cannot use anything beside bare IP addresses, protocol and ports. As a consequence, an application defined on a given VLAN, MAC address or protocol stack will never accept a NetFlow.
All rules are checked one after the other and the first matching rule gives the flow its application, in a process similar to the one used for zone attribution.
The priority of these rules can be changed to alter the order in which these checks are performed.
For more information about the configuration of applications, refer to the Configuration section.
Examples
An application which is run on a server which has an IP of 192.168.1.4 with MSSQL
will be defined as follows:
- Port Range:
1433. - IP protocol:
TCP. - IP Server:
192.168.1.4/32.
An HTTP application running on a server along with several other applications will be defined as follows:
- Web Application Pattern:
*intranet.securactive.lan*.
IP Merging
In order to maximize usage of the available disk space, some information are removed to allow better aggregation. This is the case for IP data of foreign host on aggregation levels 3 and 4.
Principle
Upon data consolidation at the third aggregation level, all IP tagged on the Internet zone (or whatever name was given to this default zone) will be removed in favor of a merged identifier. Consequently, these IPs will appear as merged in all tables where IP values are displayed if the IP was belonging to Internet Zone and your observation period is such that the third or the fourth aggregation level is used. This will happen with long observation periods (> 8 hours) and also on old data (> 1 week old).
Example
Let’s say a user has access to the Internet zone using the same
application; for example, a web browser using HTTP on port 80
to access to different web sites for a period of time. Originally,
you will see for that period.
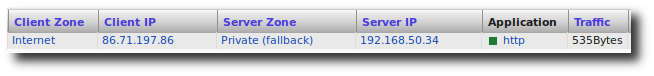
TCP conversation before degradation
Once data has been aggregated, if you query the same period of back in time, you will have:
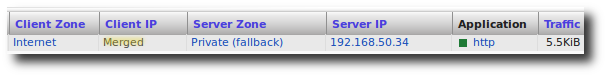
TCP conversation after degradation
For the Client IP, merged means that the two conversations to the
different Internet clients have been merged into one single
entry. This is only done when the Zone is Internet and matches the
same server / application couple. So, you still know that this server
was accessed from the Internet zone with the http application on
the port 80.
Conversation
Objective & Definition
The objective of a conversation is to group a set of data exchanges between two hosts for a single application into one basic entity to be able to generate a more user-friendly report on network traffic.
A flow is a group of data exchanges between two hosts for one application over the aggregation period. A conversation is a group of flows over the observation period. The observation period is defined by a start time and an end time provided by the user. A conversation is defined by the following criteria:
- The device identifier that received the packets
- The VLAN tag that might be present in the packets
- Source or client IP address (please refer to the chapter Types of Conversations).
- Destination or server IP address
- Application (please refer to the chapter Application)
Types of Conversations
SkyLIGHT PVX offers two ways to analyze network conversation. From a user’s perspective, network conversations can be seen in two different ways, which correspond to two different needs: Client/Server or Source/Destination. This chapter explains how those views differ, which kind of information they provide, and how they can be used.
Source / Destination
In a source/destination conversation, all flows between two hosts will be classified following the concepts of source and destination. This means that the flows will group data exchanges from a source IP address to a destination IP address regardless of whether they function as a client or a server.
For instance, a traffic from A to B for an application will be broken
down in two conversations: a conversation from A to B and a
conversation from B to A.
Src/Dst conversations correspond to a view of network flows for traffic analysis. When reviewing data for traffic analysis purposes, an administrator wants to view flows without considering the role of each host, that is to say, disregarding if the host is a client or a server.
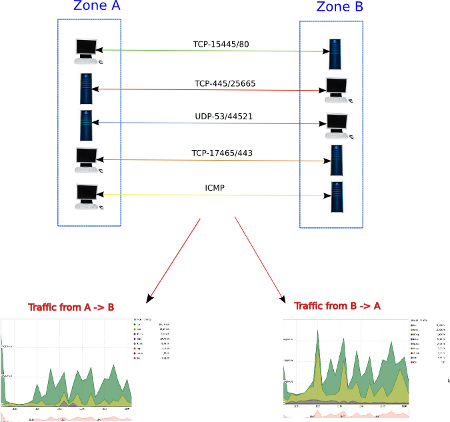
Source/Destination treatment
from A to B takes into account all traffic
coming from a host in A to a host in B, regardless of the role they
played (client or server). The above graphs take into account the
communications from A to B, only in one direction.Client / Server
In a client/server conversation, all flows between two hosts will be classified following the concepts of client and server. This means that the flows will group data exchanges to (and from) a client IP address from (and to) a server IP address.
from A to B for an application
(provided both A and B can be a server for a single application)
will be broken down in two conversations: a conversation for
client A & server B (with traffic from A to B and from B
to A) and a conversation from client B to server A (with traffic
from A to B and from B to A).Clt/Srv corresponds to a view of network flows for performance analysis. When reviewing data for performance analysis purposes, an administrator wants to view flows in function of the role of each host, client or server. Indeed, the role of a host has an impact on the metrics displayed and the clients and servers cannot be mixed.
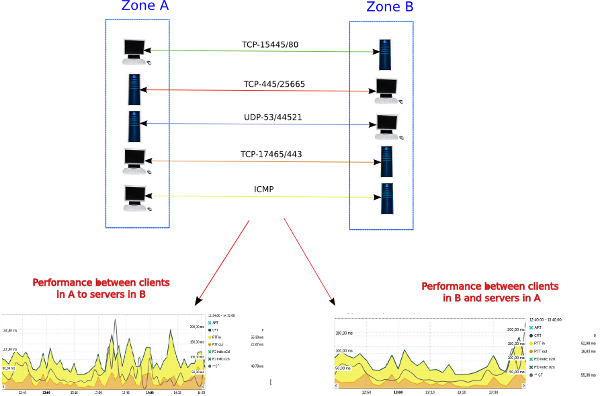
Client/Server treatment
For example, the clt/srv graphs shown above will be generated taking into account the communications:
- from clients in A to servers in B
- from servers in B to clients in A
In short, the traffic displayed in client/server conversations will take into consideration the data transfer in both directions.
Note
The appliances can only distinguish reliably clients from servers when the IP protocol in use is TCP, when the connection establishment was successfully received by the probe, and when the connection state is sufficiently active to not be in timeout. In all other cases, the probe assumes that the lower port is used on the server’s side.
Where are both being used?
Src/Dst will be used for all views of oriented traffic, i.e., where the reports need to show the amount of data from one zone to another zone. Hereunder (in the first and second lines of the table) you can see that the data exchange between the two hosts has been split into two conversations from A to B and from B to A.
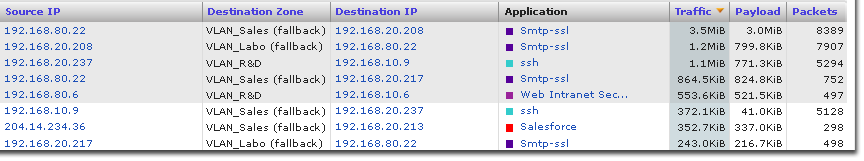
Source/Destination conversations
On the other hand, client/server conversations will be used for all views reporting performance. Hereunder you can see (in the first line of the table) that a client/server conversation takes into account the traffic in both directions.
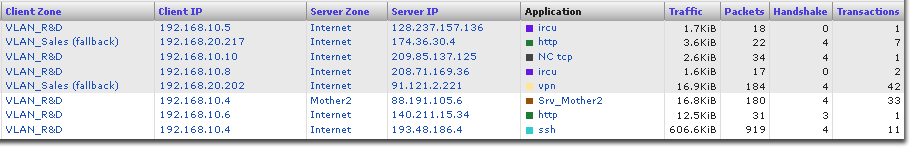
Client/Server conversations
In general, you will find that:
- Client/Server is relevant when we are speaking about Performance;
- Source/Destination is relevant when we are speaking about Usage.
Top-Down Analysis
The Src/Dst matrix can be the starting point for a fine-tuning analysis of traffic: bandwidth and conversation. In each cell, there are two buttons:
- one to display the bandwidth graph
from zone A to zone B - one to display the conversations
from zone A to zone B.
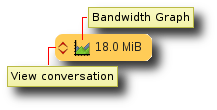
Cell detailed view
The first link will open the conversation table and will display all the traffic between the two zones, whereas the second one will display a bandwidth chart from the source zone on the left and the destination zone on the top.
Data Aggregation
Rationale
By nature, the operations of statistical analysis require the storage of large amounts of data. Furthermore, that data must be stored over extended periods of time so as to expose overall trends. In order to minimize storage space while still making it possible to reveal trends over weeks or months, SkyLIGHT PVX automatically summarizes the collected data. The process of creating these summaries is called aggregation.
Process
Aggregation occurs automatically. Whenever your probe displays a chart or a table, this is based on already aggregated data. In order to display this, SkyLIGHT PVX first decides on an aggregation granularity depending on the length of the time period you requested and how far back into the past it goes.
Note that because the higher aggregate levels summarize more data at once, they take up less disk space, and can be kept in storage much longer without filling out the hard drive. This strikes a good balance between data granularity and duration of retention: performance data with the best granularity will occupy much of your disk space, and long-lasting global trends can be exposed from far back (albeit with less detail), all from the same interface.
Requests
Generaly the chosen aggregate level is transparent for the user. The system will query the one that minimizes the computing effort for the same result. But when large interval are requested, data can be degraded to guarantee a fast enough response latency.
Depending on your particular needs, it may be necessary to request
more data points in graphs or to split a particular flow into smaller
chunks to get a more precise timeline. The Mode option allows you
to specify how the data granularity will automatically change
depending on how far back you request, how many columns are requested
(using themes) and how much filtering is applied to the page. Choosing
the default Fast mode will report fewer data points or possible
simpler data. The Precise mode will report more data points or
more detailed data but may also extend your querying time. (See
Precision mode for more details about the precision mode.)
If the data can be extended with more details, the option will be
presented as a Refine button, that let you ask the page to query
again with a higher level of resources allocation. This will be
usually slower (up to several minutes for some complex pages). This
refinement is applied for the current page. When navigating to other
pages, or when submitting a new search, this will default back to the
current Mode (Fast or Precise). The same behavior apply
when a page is added to a report. Note that increasing resources
allocation will work with no guarantee and may trigger an error if
there is not enough physical memory on the node that executes the
query.