Deployment
How to Integrate PVX in Your Network
Preliminary steps
SkyLIGHT PVX is dedicated to analyzing the performance of business critical applications in a corporate network. Hence, the preliminary steps to be done before considering integrating SkyLIGHT PVX into your network are:
- identifying an up-to-date list of business critical applications (including applications directly supporting business processes and the applications on which these may rely, e.g., DNS, Microsoft-DS, etc.),
- locating the servers hosting these applications, and
- defining which network devices clients are using to access these applications.
Positioning the probe
The SkyLIGHT PVX appliance will be installed as close as possible to to the servers to provide the best analysis. Measurements are more accurate if the probe is in a central location next to the server. You will get a wider view of the performance experienced by all the users connecting to this server.
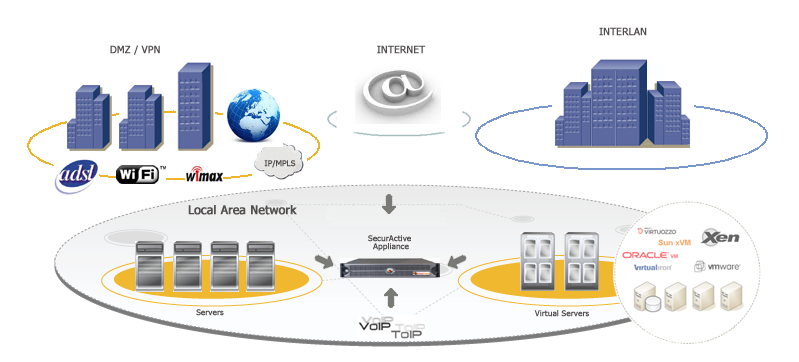
PVX network positioning synoptic
Choosing a traffic capture method
Two main methods may be used to establish a permanent point of traffic
capture: TAP or SPAN. A TAP is a network device which will
be installed in-line on the network and will send a copy of the
traffic on one or two listening ports of the probe. A SPAN (also
commonly called port mirroring) is a feature of network switches that
enables a network administrator to send a copy of a given traffic on
one or several interfaces / VLANs to a mirroring port.
The most commonly used method is the SPAN port (port mirroring)
mainly because it enables administrators to monitor any traffic going
through the switch with an existing network device. Collecting
traffic through a SPAN port will likely not generate any
additional point of failure on the network and will be regarded as a
minor modification of its existing configuration. Network TAPs
are also an option (if no SPAN is feasible, for example) but the
traffic captured will be limited to the network link(s) going through
the TAP. A connection via TAP incurs additional costs.
If you choose to capture network traffic through a SPAN, you
should be careful not to copy the same traffic to the listening
interface twice (which would degrade the statistics provided by the
probe).
How to Capture Traffic
SkyLIGHT PVX can rely on two mechanisms to capture network
traffic: port mirroring (commonly called SPAN) and terminal
access point (TAP).
Port mirroring
Port mirroring, also known as SPAN or roving analysis, is a
method of monitoring network traffic which forwards a copy of each
incoming and/or outgoing packet from one (or several) port(s) (or
VLAN) of a switch to another port where the analysis device is
connected. Port mirroring can be managed locally or remotely. To
configure the port mirroring, an administrator selects one or several
ports from which all packets will be copied (source ports) and another
port or ports to which the copy of the packets will be sent
(destination port). The administrator can include either all packets
in the port mirroring or only the transmitted/received packets. If
both transmitted and received packets are included, a packet going
from one monitored port to another will be copied twice to the
destination port. This will have an impact on the measures and
performance provided by the analysis device (e.g., retransmission
rates, response times, etc.). SkyLIGHT PVX captures and
evaluates the data without any impact to the original traffic.
The port mirroring is the most commonly used solution to capture traffic because it is inexpensive, flexible in terms of how much traffic can be captured at once, and remotely configurable.
Please note that a port mirroring may have some drawbacks, such as:
- It can consume significant CPU resources while active
- There is a risk of not receiving some packets (due to media errors)
- In the case of traffic congestion at the switch level, the port
mirroring is likely to drop some traffic (because the
SPANprocess does not have priority).
In some cases, a better solution for long-term monitoring may be a
passive TAP or an Ethernet repeater (”hub”).
Advantages
- Low cost (this feature is embedded in most switches)
- Can be configured remotely through IP or Console port
- The only way to capture intra-switch traffic
- A good way to capture traffic on several ports at once
Drawbacks
- Not adequate for fully utilized full-duplex links (packets may be dropped)
- Filters out physical errors
- Impact on the switch’s CPU
- Can alter the timing of the frame (with an impact on response time analysis)
- SPAN has a lesser priority than port to port data transfer
Network TAP
A network TAP (Terminal Access Point) is a hardware device which
can passively capture traffic on a network. It is commonly used to
monitor the network traffic between two points in the network. If the
network between these two points consists of a physical cable, a
network TAP may be the best way to capture traffic. The network
TAP has at least three ports: a port A, a port B, and a monitor
port. To place a tap between points A and B, the network cable between
point A and point B is replaced with a pair of cables, one going to
the TAP’s A port, one going to the TAP’s B port. The TAP
passes all traffic between the two network points, so they are still
connected to each other. The TAP also copies the traffic to its
monitor port, enabling an analysis device to listen. Network TAPs
are commonly used by monitoring and collection devices. They
can also be used in security applications because they are
non-obtrusive, are not detectable on the network, can deal with
full-duplex and non-shared networks, and will usually pass through
traffic even if the tap stops working or loses power.
Advantages
- No risk of dropped packets
- Monitoring of all packets (including hardware errors - MAC and media)
- Provides full visibility including congestion situations
Drawbacks
- The device may require two listening interfaces on the analysis device
- Costly
- No visibility on intra-switch traffic
- Not appropriate for the observation of a narrow traffic range.
Supported Protocols
The PVX sniffer can detect all Ethernet packets even if those packets
have a VLAN tag in their Ethernet header. SkyLIGHT PVX also
accepts both IPv4 and IPv6 protocols.
Note
Non-Ethernet flows are invisible in the PVX solution.
Non-IP Protocols
If the Ethernet protocol is not an IP protocol, it will appear in the Non IP submenu. These data will not appear elsewhere.
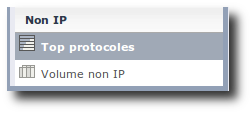
Non-IP protocols menu
IP protocols
IPv4 and IPv6 are both captured and split in four Level 3/4 protocols: TCP, UDP, ICMP and OtherIP.
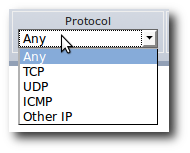
Level 3/4 protocol filter
Some of these data are duplicated in other specialised categories: Web, VoIP, DNS to display more specific metrics.
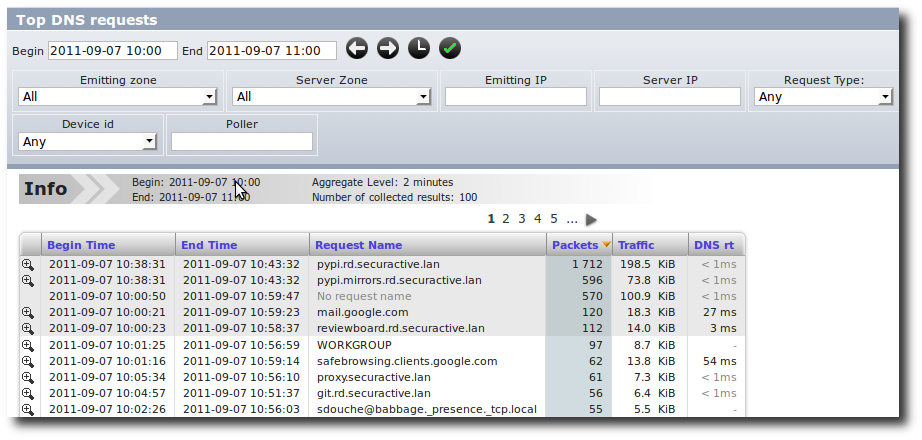
DNS specialised view
Limitations
If the rate of incoming packets exceeds the rate at which the sniffer can parse the traffic for too long, then some packets may be dropped by the Linux kernel. These packets won’t get accounted for in the GUI.
As a real-time protocol analyzer, the sniffer is also limited in what protocols it supports and how deep it inspects packets. Here is a quick overview of the most obvious limitations:
- Ethernet parser supports Linux cooked capture extension (used when capturing on “any” interfaces) and 802.1q VLAN tags. All other Ethernet extensions are ignored.
- ARP parser knows only Ethernet and IP addresses.
- DNS parser supports MDNS, NBNS and LLMNR to the extent where these protocols mimic legacy DNS (with the exception that it can unscramble NetBios encoded names).
- FTP connection tracking merely looks for EPSV, PASV or PORT commands in the TCP stream without much care for the actual protocol.
- TCP options are ignored.
- PostgreSQL parser only supports protocol version 3.0 and MySQL parser only supports protocol version 10. This should cover most of the installed bases, though.
- TNS parser (for Oracle databases) was roughly reverse-engineered from various sources, especially the Wireshark source code. Thus, it should not be expected to understand all messages in all situations.
- SIP parser implements no proprietary extensions, however prevalent.
- As there is no concept of connections for UDP, UDP conversations are ended after a timeout period of 2 minutes without any packet in any direction. This might not match the underlying protocol.
- VoIP dialogs are identified by their call-ID only, which implies that if the sniffer listens to various independent SIP proxies or servers, then call-ID collisions cannot be ruled out (this choice was made because it proved useful in practice).
Port-Mirroring and Duplicated Packets
Introduction
The configuration of a port-mirroring session has to respect some specific rules and standards. The main goals of a port-mirroring session are to:
- Gain insight into the highest number of flows, which are seen as strategic by the IT manager, and
- Ensure that all collected flows are appropriately analyzed.
It is crucial to ensure that a minimum number of flows are duplicated to the interfaces.
Detail
PVX solution can manage any level of traffic duplication (dropping packets received in excess). This, however, involves a significant loss of performance. There are two main rules:
- Basic port-mirroring sessions, also called 1-to-1 port-mirroring session. This configuration does not generate duplicated packets. However, increasing the number of 1-to-1 port-mirroring sessions could produce this phenomenon.
“1-to-1” port mirroring session
- Multiple port-mirroring sessions, also called N-to-1 port-mirroring session. In this specific event, the duplicated packets can occur.
“N-to-1” port mirroring
Warning
- According to the number of listening points in a multi-switch mode, this phenomenon can occur despite the use of a 1-to-1 port-mirroring session.
- A VLAN is a set of ports; this means that the port-mirroring session is a N-to-1 port-mirroring session.
Some examples of duplicated packets / non-duplicated packets
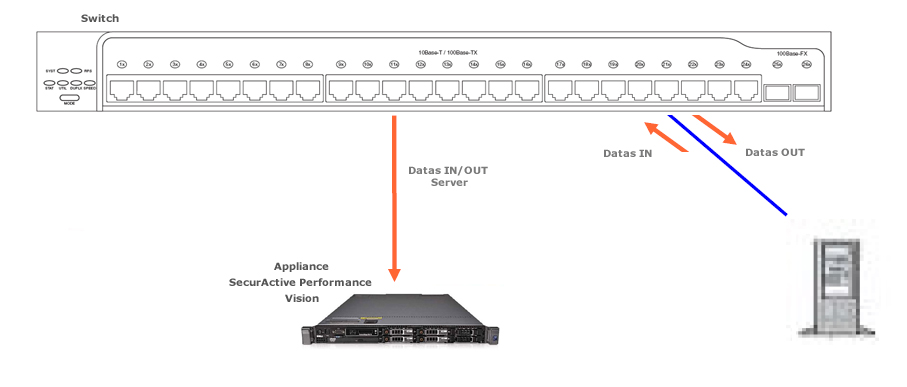
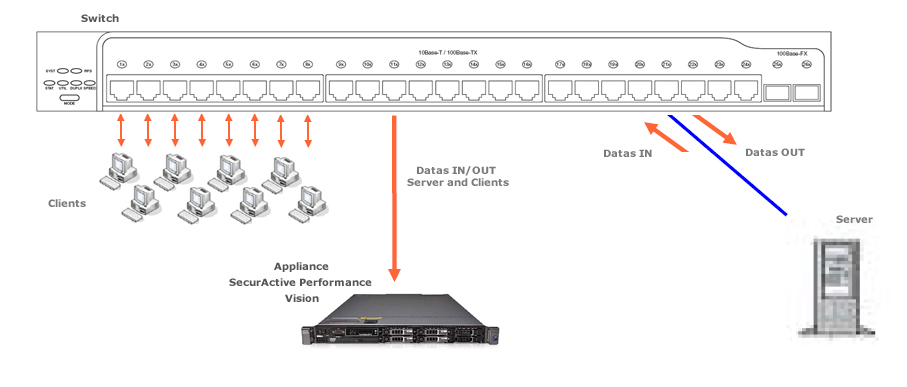
In a standard port-mirroring configuration (N-to-1), it is highly likely that some packets transmitted to the appliance are duplicated. In the following example, configuring a port-mirroring session on both the IN traffic and the OUT traffic of the switch means that the appliance will receive the same traffic twice:
Example with duplicated packets
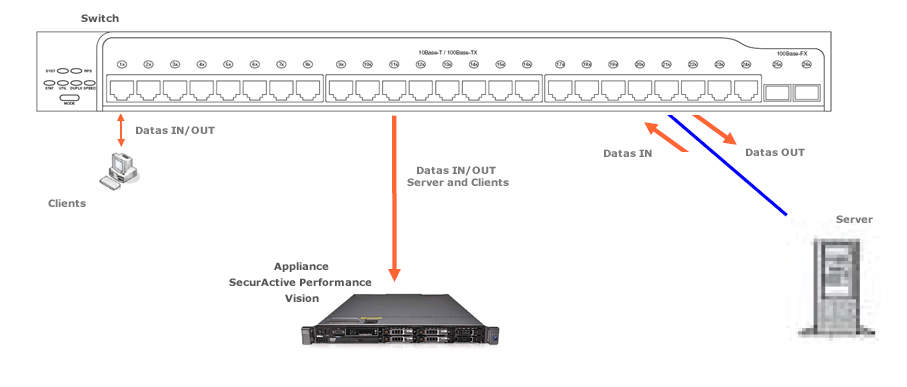
By only listening to the IN traffic (or only the OUT traffic) on the concerned Ethernet ports, we will ensure the flow transmission to be unique between the client and server, thus avoiding the duplication of packets:
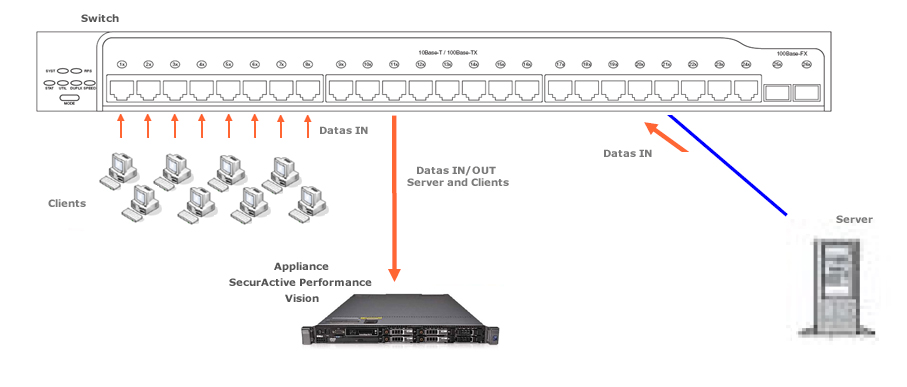
Example without duplicated packets
Note
In the event of an N-to-1 port-mirroring session, the total bandwidth of the “source” Ethernet ports of the mirror should not exceed the maximum bandwidth of the “destination” Ethernet ports of the mirror.
Removal of duplicated packets
The SkyLIGHT PVX system checks and controls the duplicated packets phenomenon on all listening ports. It also ensures all duplicated packets are removed. However, in some cases, some duplicated packets could be mixed up with retransmitted packets.
It is therefore crucial to minimize the duplicated packet rate (or at least to arrange the mirroring so that duplicates follow the original as closely as possible). In order to reach a low rate of duplicated packets, the appliance provides information on the duplicated packet rate through the Pulsar command:
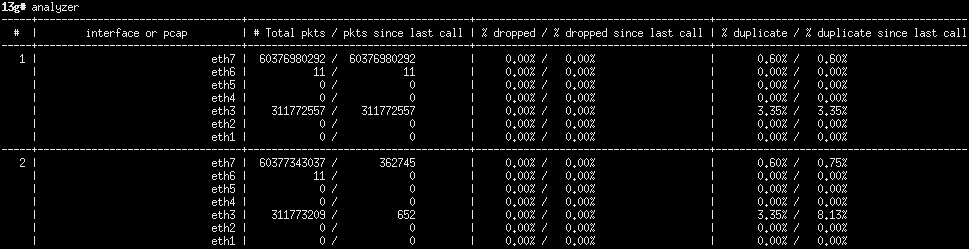
Information on the duplicated packets rate in Pulsar.
Here, on average, 3.35% of the traffic is duplicated on the interface eth3.
Deduplication algorithm
The sniffer usually receive frames from multiple locations on a network, and so it can be cumbersome (if not impossible) to avoid the situation where the same frames are mirrored several times toward the probe. Deduplication is the process of selectively ignoring packets that are artificial duplicates due to the network infrastructure. On the other hand, automatic deduplication makes it harder to find out if duplicates were present in the network in the first place.
The sniffer detects and drops duplicate frames based on a digest of some parts of their headers and payload. The Maximum duplicate delay for which the sniffer will remember these digests is configurable from the Nodes Management page.
The sniffer will take into account the following information from the packet’s header (if present):
- from Ethernet, the VLAN if Ignore VLAN tags isn’t set in the Nodes Management page
- from IP, the addresses and the transported protocol
- from UDP, everything
- from TCP, the flags, ports, sequence and acknowledgement numbers, the window, ...
We deliberately ignore MAC addresses, IP’s TTL, ToS, options, checksum, TCP’s options and others as they may be altered by different network equipments (for example after going through routers). Along the way, we also decapsulate possible tunnels, like GRE.
Once the sniffer doesn’t recognize the protocol as a transport protocol, it interprets the rest of the packet as the inner payload to be digested.
Notice that TCP duplicate acknowledgements may be deduplicated due to the fact their headers are similar and that they do not transport any payload. Tuning the default delay of 100ms may help report a more accurate number.
Distributed Architecture
How does the distributed infrastructure work?
Appliances hosting only the sniffer component of PVX are called “captures” (called “pollers” in older versions of PVX). The appliance hosting the components in charge of collecting, merging and integrating the data from the capture probes into a single database is called a “datastore”. The datastore appliance may also host one sniffer component.
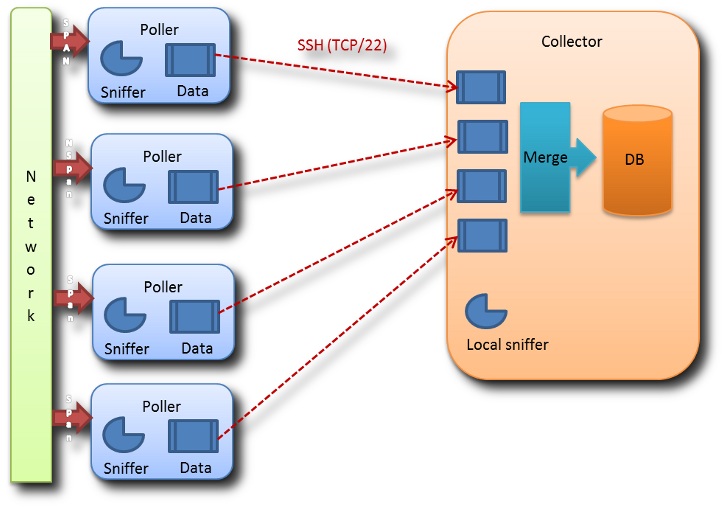
The captures listen and analyze the network traffic. The datastore receives data from the captures, integrates them into the database, and then provides an access to the data through the Web UI.
The Nodes Management page in the Configuration menu displays some status information about captures.
Where is data being merged / segregated?
The data is merged (i.e., the data is integrated in the reports with no consideration for the capture which has captured it) in:
- Business Critical Application Dashboard.
- Application dashboards.
- Graphs (performance, bandwidth, matrix).
- Comparison tables (Client / Server, Network performance, Application performance).
Please note that in these reports, you can enter a filter to view the data captured by one capture only. The data is segregated (i.e., the data is kept separated depending on the capture which captured the data) in all other tables. Please note that in reports you will get two lines for a single conversation viewed by two captures.
How to configure a capture probe
The preferred way to configure a capture probe is through the Nodes Management page in the Configuration menu.
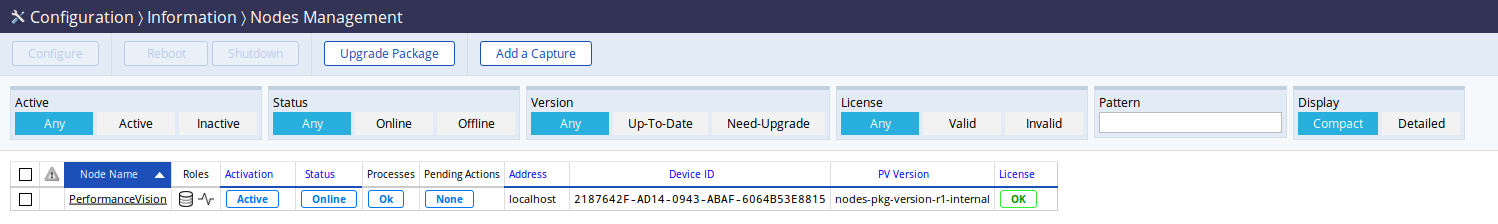
The Nodes Management page with only one datastore.
To add a new capture, simply use the Add a Capture button to be
guided through the necessary steps.
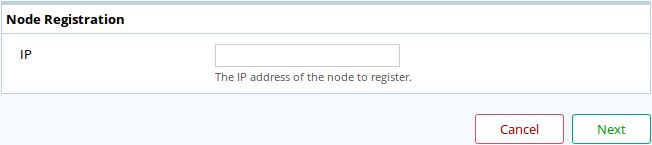
The Add a Capture dialog box.
Enter the IP or DNS of the capture to be registered and click Next.
To ensure you are not a victim of any attack or impersonation, the datastore needs a PIN code to authenticate itself and will present you the SSH key fingerprint of the capture you’re trying to add.
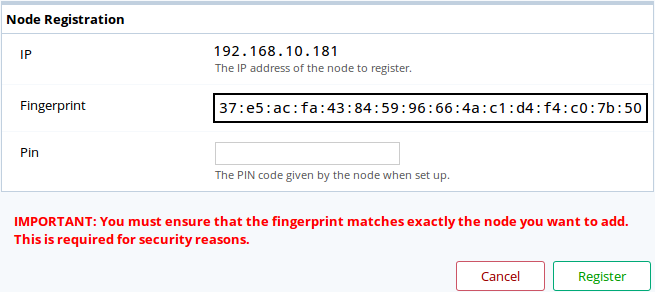
The registration confirmation step of the Add a Capture dialog box.
To generate a PIN code, use the Pulsar shell on the capture,
with the register pin create command.
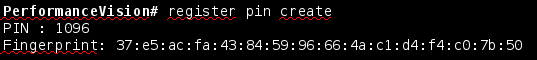
The PIN code creation on a capture will also show you that capture’s key fingerprint needed to confirm it on the datastore.
Note
When installing a capture license on a probe that was in
datastore role, close all running Pulsar sessions and start
anew to take into account the change of role.
Else you will have an error message when executing the command
register pin create.
You should first check that the key fingerprint shown by the datastore is the
capture’s fingerprint. Once verified, enter the PIN code and click the Register button.
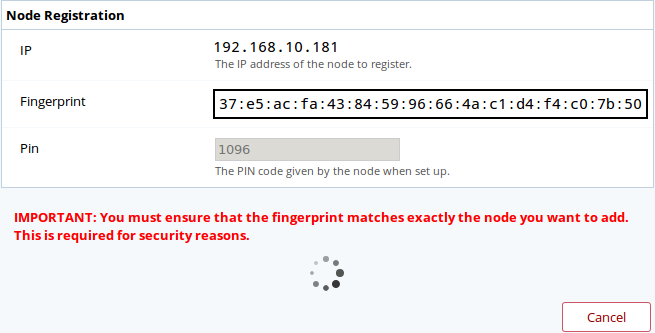
The datastore is registering itself to the capture. It may take a few seconds.

The capture has been successfully registered and is now attached to the datastore.
To edit the capture’s configuration you may click on its name or select it and click on
the Configure button on the top-left of the page. Note that you can edit multiple
captures simultaneously.
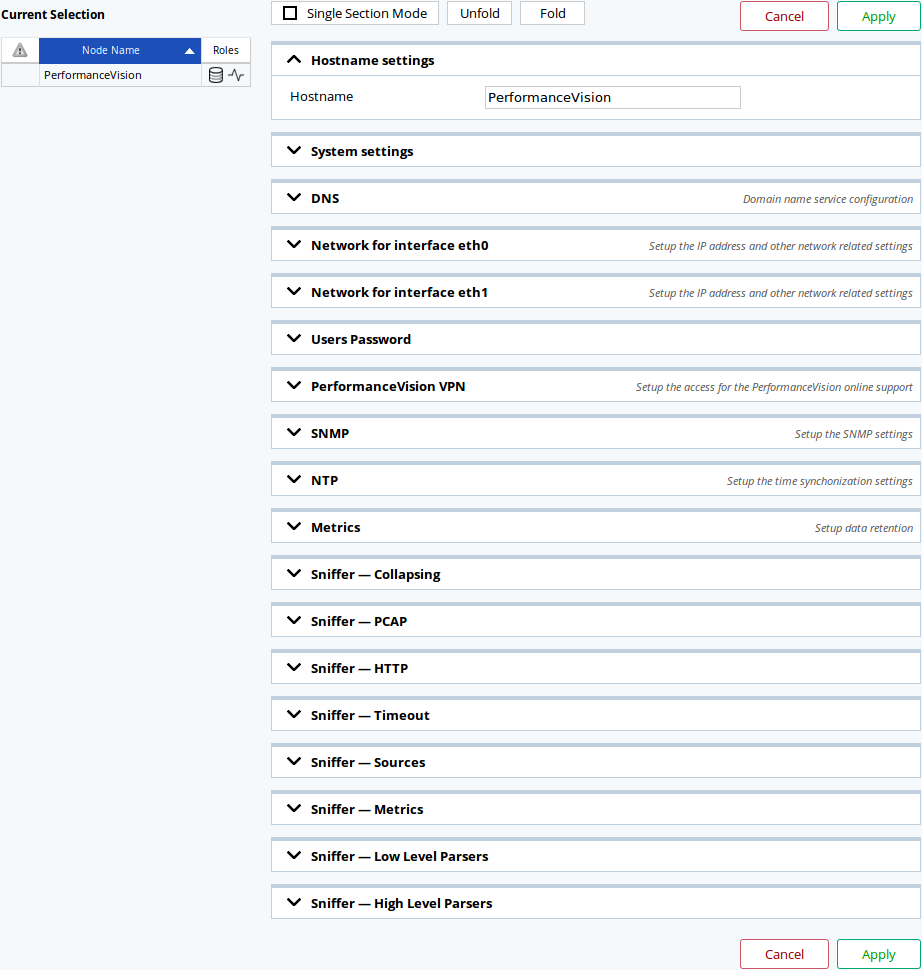
The configuration page for captures.
Any modification done here will be applied to the capture after a short time.
What happens if a capture probe does not respond?
A capture that is missing won’t impact the data integration for the other
captures. The data of the missing capture will be temporarily stored
on the capture itself for a limited amout of time (which is configurable via
Pulsar by using the csv retention command).
When the capture becomes reachable again, the datastore will integrate
its stored data.

A warning will be displayed on the Nodes Management page when the datastore can’t reach a capture,
Limits
The distributed architecture provided by version 2.5 has some intrinsic limits:
- There is no feature for deduplication between captures (i.e., a network flow captured by two captures will be counted twice in reports that merge data from several captures). [1] But you can filter the data for each capture.
- If there is some load balancing at the packet level (and not at the session level) and two captures view two different parts of the traffic, the datastore will not be able to rebuild these flows and no performance metric will be available in this case. [2]
- The positioning of each capture with regards to client and server will have some impact on some metrics (SRT, RTT Server, RTT Client, RR Server, RR Client, etc.).
- The maximum number of sessions handled by the datastore remains unchanged (approximately 100k concurring sessions).
Prerequisites
- All captures have to be synchronized to a single NTP.
- All captures and datastore require an administration port connected to the network and a fixed IP address.
- Connectivity between captures and datastore on port
TCP/22is required. - Some network capacity is required to transfer the data from the captures to the datastore (current evaluation is 0.2% of the analyzed bandwidth).
Adequate / non-adequate implementations
| Situation | Fit for version 2.5 | Comments |
|---|---|---|
| Two data centers (Active / passive) | Distributed may or may not be required. | Most applications will be deployed in normal conditions on DCa; if under normal conditions DCb receives no production traffic, a second probe may not required; if applications are, under normal conditions, distributed between DCa and DCb, then a distributed implementation is required. |
| Two data centers (Active / Active) | Distributed is adequate. | If the traffic between servers is captured, it may be counted twice; traffic from clients to servers should be counted only once. |
| N data centers through WAN. | Distributed is adequate. | Traffic between servers will be captured twice and double counted. |
| N data centers and M remote sites | Distributed may not be adequate. | The traffic going from the remote sites to the data centers will be double counted. The cost of deploying physical units may be superior to the benefit. |
| [1] | This is a rare case and is not handled by the non-distributed implementation of SkyLIGHT PVX nor by most competitors. The bypass option would be to use TAPs to re-aggregate both flows before it reaches the interface of the capture. |
| [2] | This is already the case in a non-distributed implementation. The only new element is the fact that data will be more readable if all captures have the same capture points. |
Virtual SkyLIGHT PVX
SkyLIGHT PVX was design to work natively as a virtual machine. For now only VMware is supported.
Note
There is a dedicated chapter about Virtual Appliance Step-by-Step.
NetFlow
Introduction
The goal of NetFlow is to collect various statistics about the network traffic passing through network equipments. Not all network equipments allow exporting statistics as NetFlow.
- The major NetFlow versions in use are:
- NetFlow v5
- NetFlow v9
- IPFIX
NetFlow protocols were first established by Cisco® but are not actual standards.
NetFlow v5 may be considered as the most common version, providing some basic statistics export but is inherently limited to IPv4.
NetFlow v9 may be considered as the next major version, its strength and complexity lays in its template-based approach of delivering statistics. It has been described in an informational RFC3954 [3].
IPFIX, also known under the ‘NetFlow v10’ name, is largely inspired by NetFlow v9 but the protocol itself isn’t quite compatible. IPFIX has been standardized in RFC5101 [4].
| [3] | https://tools.ietf.org/html/rfc3954 |
| [4] | https://tools.ietf.org/html/rfc5101 |
PVX and equipment configuration
The equipments should aggregate flows based on time instead of sending per-packet or per-event flows (as PVX has no reliable way to understand the event that caused the flow to be sent in the case of NetFlow v9 and IPFIX).
PVX uses the timestamps from the NetFlow packets, it is required that those are accurate. Configuring NTP on SkyLIGHT PVX and your equipments is a reliable way to ensure everything is synchronized.
Moreover, the equipments’ NetFlow configuration should ensure that flows are sent at maximum every minute. Equipments could be configured to send flows more frequently (for example, every 30 seconds) if they can’t send the flow in a timely manner. PVX will aggregate them as it does for sniffed flows.
The sniffer may be configured to listen for other ports on the Nodes Management page. By default, it listens on the standard UDP port 2055 and 4739. For completeness, it also listens on UDP ports 9555 & 9995.
NetFlow v5
The statistics reported by NetFlow v5 are static and as such, PVX can easily retrieve and integrate some of them.
The following fields are used by PVX (note that the NetFlow v5 being not officially described, names from Cisco’s [5] and Wireshark are both presented here for easier reference).
| [5] | http://www.cisco.com/c/en/us/td/docs/net_mgmt/netflow_collection_engine/3-6/user/guide/format.html |
Fields used by PVX from the NetFlow v5 header to export statistics:
| Cisco name | Wireshark name | Description |
|---|---|---|
| SysUptime | SysUptime | Uptime of the network equipment, in milliseconds |
| unix_secs | CurrentSecs | Timestamp, in seconds, since Epoch |
| unix_nsecs | CurrentNSecs | Nanoseconds to be added to the timestamp |
Fields used by PVX from the NetFlow v5 flow data to export statistics:
| Cisco name | Wireshark name | Description |
|---|---|---|
| srcaddr | SrcAddr | The IPv4 source address |
| dstaddr | DstAddr | The IPv4 destination address |
| input | InputInt | The network equipment’s input interface number |
| output | OutputInt | The network equipment’s output interface number |
| dPkts | Packets | The number of packets in this flow |
| dOctets | Octets | The number of octets in this flow |
| First | StartTime | The network equipment’s SysUptime at the start of the flow |
| Last | EndTime | The network equipment’s SysUptime at the end of the flow |
| srcport | SrcPort | TCP or UDP source port |
| dstport | DstPort | TCP or UDP destination port or ICMP type and code |
| prot | Protocol | IP protocol |
| tos | IP ToS | IP Type of Service |
Note that PVX only handle the IP protocols of ICMP (1), TCP (6) & UDP (17).
ICMP changes the meaning of the ports: the destination port encodes both the ICMP type and codes (as ICMP type * 256 + ICMP code).
NetFlow v9 and IPFIX
Compared to NetFlow v5, the statistics reported by NetFlow v9 and IPFIX are more numerous and more complex. Approximately 500 are standardized and vendors may extend them.
The complete list of standardized IPFIX entities are available at IANA [6]. NetFlow v9 entities declared in the RFC are compatible with IPFIX entities and as such, their IANA or RFC name will be used in this document.
| [6] | https://www.iana.org/assignments/ipfix/ipfix.xhtml |
The extensibility of NetFlow v9 and IPFIX is in the use of templates. Templates are special flows that describes which entities other flows may contain. The sniffer keeps templates in memory for each NetFlow sender and any flow whose template hasn’t been seen yet will be dropped. The NetFlow sender could either send templates regularly and separately or with other flows.
As such you should configure your templates to include entities described below.
Fields used by PVX from the NetFlow v9 header to export statistics:
| RFC name | Wireshark name | Description |
|---|---|---|
| sysUpTime | SysUptime | Uptime of the network equipment, in milliseconds |
| UNIX secs | Timestamp | Timestamp, in seconds, since Epoch |
Fields used by PVX from the IPFIX header to export statistics:
| RFC name | Wireshark name | Description |
|---|---|---|
| Export Time | Timestamp | Timestamp, in seconds, since Epoch |
Required time fields used by PVX from the NetFlow v9 or IPFIX flow data to export statistics:
| IANA names | Wireshark name | Description |
|---|---|---|
| flowStartSysUpTime, flowStartMilliseconds, flowStartDeltaMicroseconds | StartTime | Start of the flow, varying unit |
| flowEndSysUpTime, flowEndMilliseconds, flowEndDeltaMicroseconds | EndTime | End of the flow, varying unit |
PVX handle different fields from the NetFlow v9 or IPFIX flow data to export statistics:
| IANA name | Wireshark name | Description |
|---|---|---|
| sourceIPv4Address | SrcAddr | The IPv4 source address |
| destinationIPv4Addres | DstAddr | The IPv4 destination address |
| ingressInterface | InputInt | The network equipment’s input interface number (most of the time, it’s the interface’s SNMP ID) |
| egressInterface | OutputInt | The network equipment’s output interface number (most of the time, it’s the interface’s SNMP ID) |
| packetDeltaCount | Packets | The number of packets in this flow |
| octetDeltaCount | Octets | The number of octets in this flow |
| sourceTransportPort | SrcPort | TCP or UDP source port |
| destinationTransportPort | DstPort | TCP or UDP destination port or ICMP type and code |
| protocolIdentifier | Protocol | IP protocol |
| ipClassOfService | IP ToS | IP Type of Service |
| icmpTypeCodeIPv4 | ICMP Type | ICMP type and code |
| icmpTypeIPv4 | IPv4 ICMP Type | ICMP type |
| icmpCodeIPv4 | IPv4 ICMP Code | ICMP code |
As shown in the previous tables, multiple NetFlow v9 or IPFIX entities may map to the same or similar information.
All of the standardized entities are not implemented due to a lack of examples from a production site or impossibility to integrate into the design. If a missing entity’s information could be used by the sniffer it could be later added in exchange of a PCAP file.
Most of the required entities are similar to the ones present in NetFlow v5, the base information required for any flow is:
- start & end of the flow
- ingress & egress interfaces
- IP protocol & ToS
- source & destination addresses
- number of bytes
- number of packets
Any flow not containing the base information won’t be integrated by PVX. Moreover, the following layers require more information, specific to each:
- TCP: source & destination port
- UDP: source & destination port
- ICMP: type & code
However, note that due to different implementations, PVX can not assert that the destinationTransportPort may contain ICMP information as in NetFlow v5 and as such, relies on the ICMP entities.
Examples
This a flow that may induces problems due to its too long duration. Note that even if the IP protocol is UDP, ICMP information may still be send depending on your templates.
$ tshark -V -r some.pcap
...
        Flow 5
          SrcAddr: 1.2.3.4 (1.2.3.4)
          DstAddr: 6.7.8.9 (6.7.8.9)
          SrcPort: 3544
          DstPort: 51655
          IPv4 ICMP Type: 0
          IPv4 ICMP Code: 0
          IP ToS: 0x00
          Protocol: 17
          InputInt: 43
          TCP Flags: 0x00
          Octets: 548
          Packets: 4
          [Duration: 75.000000000 seconds]
              StartTime: May  5, 2017 17:06:28.056000000 CEST
              EndTime: May  5, 2017 17:07:43.056000000 CEST
          OutputInt: 0
...
This is a flow that won’t be integrated due to missing several required entities. Note that NAT entities won’t be used by PVX.
$ tshark -d 'udp.port==9995,cflow' -V -r some.pcap
...
      Flow 14
          SrcAddr: 1.2.3.4 (1.2.3.4)
          Post NAT Source IPv4 Address: 10.20.30.40 (10.20.30.40)
          DstAddr: 6.7.8.9 (6.7.8.9)
          Post NAT Destination IPv4 Address: 60.70.80.90 (60.70.80.90)
          SrcPort: 64507
          Post NAPT Source Transport Port: 23644
          DstPort: 22652
          Post NAPT Destination Transport Port: 22652
          Ingress VRFID: 0
          Protocol: 6
          Nat Event: 2
          Observation Time Milliseconds: Aug  5, 2014 13:18:46.246000000 CEST
...
The following excerpt of commands were successfully used on Cisco switches [7] and may be of interest.
collect timestamp absolute first
collect timestamp absolute last

match interface input
collect interface output

match ipv4 protocol
match ipv4 tos

match ipv4 source address
match ipv4 destination address

match transport source-port
match transport destination-port

match transport icmp ipv4 type
match transport icmp ipv4 code

collect counter bytes long
collect counter packets long

cache timeout inactive 60
cache timeout active 60
cache timeout update 60
| [7] | http://www.cisco.com/c/en/us/td/docs/ios/12_2/switch/configuration/guide/fswtch_c/xcfnfc.html |
Reverse proxy
Since SkyLIGHT PVX 5.0, heavy use of WebSocket is made. Configuring SkyLIGHT PVX to work with a reverse proxy requires some light setup as a simple HTTP configuration may introduce some problems difficult to diagnose.
Some configurations for well-known softwares follow.
For NGINX:
server {
  listen 80;
  server_name _;

  # WebSocket
  proxy_http_version 1.1;
  proxy_set_header Upgrade $http_upgrade;
  proxy_set_header Connection $http_connection;
  proxy_read_timeout 1800;
  proxy_send_timeout 1800;

  proxy_set_header X-Forwarded-For $proxy_add_x_forwarded_for;
  proxy_set_header X-Forwarded-Host $host:$server_port;
  proxy_set_header X-Forwarded-Proto $scheme;
  proxy_set_header X-Scheme $scheme
  proxy_set_header Host $http_host;

  location / {
    proxy_pass https://$pvx_ip:443;
  }
}
For HAProxy:
defaults
  mode http
  timeout client 30s
  timeout server 30s
  timeout connect 30s
  timeout tunnel 30m # WebSocket

backend pvx
  server pvx $pvx_ip:443 ssl verify none check weight 1

frontend pvx_http
  bind 0.0.0.0:80
  option forwardfor
  http-request set-header X-Forwarded-Host %[req.hdr(Host)]
  http-request set-header X-Forwarded-Proto https if { ssl_fc }
  http-request set-header X-Forwarded-Proto http unless { ssl_fc }
  http-request set-header X-Scheme https if { ssl_fc }
  http-request set-header X-Scheme http unless { ssl_fc }
  default_backend pvx
It is necessary to configure a long-enough timeout for WebSocket connections. The headers are necessary so the different applications can properly work; you may encounter strange behaviours if they are missing.
Obviously, these basic examples do not provide any security and they should be adapted to your requirements.