Interpreting the results
Note
With version 2.8, the in/out notion has been fully replaced by Server/Client. So in our graphs, any RTT and RR (in/out) should be considered as RTT, RR (Server/Client) as in the following rules.
RTT instands forRTT Server.RTT outstands forRTT Client.RR instands forRR Server.RR outstands forRR Client.
Business Critical Application Dashboard
To customize this view for your own needs, just go to the Configuration menu and choose the application you want to define as a ‘business’ one. (see the Business Critical Applications).
The purpose of the Business Critical Application Dashboard (BCA) is to have, regrouped into a single view, the most important elements that are critical for your business. Vital information is presented in a completely configurable and dynamic dashboard view to people in charge in order to radically improve early diagnostics and impact analysis. What is monitored is the EURT (End User Response Time) metric. Thus, this dashboard reflects the quality of experience of the users for the selected critical applications.
- In red: poor quality
- In orange: medium quality
- In green: good quality
- In grey: not enough data gathered
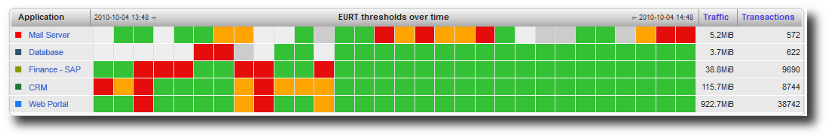
Business Critical Application Dashboard view.
Business Critical Application Dashboard Capabilities
- You can customize the business critical dashboard to view specific applications and metrics corresponding to your specific business.
- From the BCA dashboard, you can drill down from the general view to detailed analysis and problem resolution views.
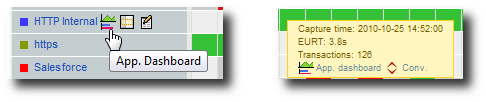
Quick links in the Business Critical Application Dashboard view.
Thus, from each Business Critical Application, with a single click on the appropriate icon, you can:
- Directly access to the corresponding Application Dashboard,
- Add a filter on this specific Critical Application (in case you have defined a lot of Critical Applications and you only want to see one for a moment),
- Edit Application characteristics.
- Directly access to the flow details for this Application.
Note
If you click on the icons that are next to the name of the application at the beginning of each line, the quick links will take into account the complete period of time currently displayed. If you click on the icons associated to a specific period of time, the quick links will used this when redirecting you to a detailed screen.
- You will always see up-to-date information with the auto-refresh feature of the BCA dashboard. The information will be automatically refreshed based on the data aggregation level (see aggregation period). For example, if the “Aggregate level” is “1 minute”, the BCA will be updated every minute; if the “Aggregate level” is “1 hour”, it will be updated every hour.
Business Critical Network Dashboard
To customize this view for your own needs, just go to the
Configuration menu and choose the entry labeled Business Critical
Network (see the Business Critical Networks).
The Business Critical Network Dashboard (BCN) is aimed at presenting in a single screen the status of your organization’s most critical network “links”. You can customize the business critical network dashboard to view the status of the most strategic links corresponding to your business.
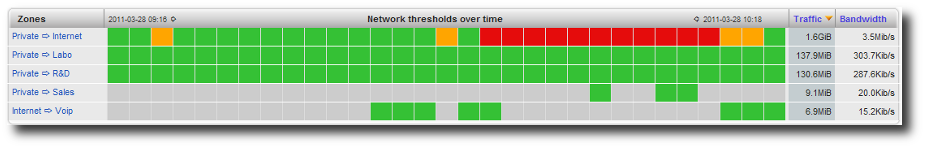
Business Critical Network Dashboard.
From the Business Critical Network Dashboard, you can drill down from the general view to more detailed information for analysis and problem resolution:
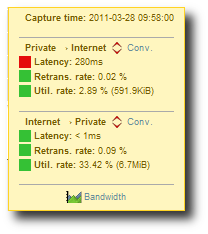
Detailed values for a point of time.
By hovering with the mouse over a cell representing a point of time,
you can view the threshold values for each direction (indicating
status OK, Warning or Alert as well as the value for
each direction). You can also access the bandwidth graphs and the
flow details table for each link. If you click on the icons that are
next to the name of the link at the beginning of a line, the quick
links will take into account the complete period of time currently
displayed. If you click on the icons associated to a specific period
of time, the quick links will use this when redirecting you to a
detailed screen. You will always see up-to-date information with the
auto-refresh feature of the BCN dashboard. The information will
automatically be refreshed based on the data aggregation level (see
aggregation period). For example, if the “Aggregate level” is
“1 minute”, the BCN will be updated every minute; if the
“Aggregate level” is “1 hour”, it will be updated every hour.
VoIP Module
A specific reporting for Voice over IP traffic is provided. The aim of this module is to show the volume and quality of service associated with VoIP flows.
Supported protocols
These VoIP protocols are supported:
SIP+RTCP+RTPMGCP+RTCP+RTPSKINNY+RTCP+RTP
For more information, please consult the corresponding RFCs:
Basics of VoIP
Voice over IP relies on three protocols to operate over IP networks:
- Signalization protocol: the role of this protocol is to
establish and control the voice communications. It usually consists
of communications between the IP phone and a call manager / IPBX.
The two signalization protocols supported are
SIP(Session Initiation Protocol) andMGCP(Media Gateway Control Protocol). Please note thatSIPmay or may not follow the same route as theRTPtraffic, whileMGCPfollows the same route asRTP(Real-Time Protocol). - Media protocol: the role of this protocol is to carry the voice
signal from one IP phone to another one (it can eventually pass
through the call manager /
IPBX).RTPis the only media protocol supported by SkyLIGHT PVX. It usually runs overUDP. - Control protocol: the role of this protocol is to carry quality
and control information from one phone to the other.
RTCP(Real Time Control Protocol) is the only control protocol supported.
Quality of service & MOS
Mean Opinion Score (MOS) is a numeric indication of the perceived
quality of service of VoIP. It ranges from 1 to 5 with 1
corresponding to the lowest quality and 5 to the highest (close to
humain voice).
| MOS Rating | Meaning |
|---|---|
| 5 | Excellent |
| 4 | Good |
| 3 | Fair |
| 2 | Poor |
| 1 | Bad |
Please note that in a real network, a MOS of over 4.4 is
unachievable. A low MOS will translate into an echo and degraded
signal. MOS is, in principle, the result of a series of subjective
tests; in the context of network analysis, MOS will be estimated
using a formula that integrates 3 factors:
- Network latency (
RTTrecommended value:<100ms) - Jitter (recommended value:
<30ms) - Packet loss rate (recommended value:
<5%)
Prerequisites
To provide MOS values for VoIP traffic, it is necessary to
capture the three flows: signalization (SIP or MGCP), media
(RTP) and control protocol (RTCP). If one of these flows is
absent in the traffic capture brought to the listening interface(s),
the MOS value will not be calculated. Other quality-of-service
metrics will remain available.
| Protocol | Metrics obtained by analysis of the protocol |
|---|---|
SIP/MGCP |
|
RTP |
|
RTCP |
|
Note
RTT and MOS values depend to some extent on the quality of
the measurement provided by RTCP. Please note that MOS is
not very sensitive to “normal” latency values. When referring to
voice or media, we refer to the RTP traffic, which may
correspond to different things (human voice, pre-recorded message,
ringback tone, busy line tone, etc.) The VoIP module discards the
jitter and packet loss data present in the RTCP flow
and replaces them with equivalent values computed internally. This
is so for several reasons:
- It was observed that many softphones do not place accurate (or even credible) values in these fields,
RTCPstream is more often missing than present, probably because it is firewalled and of little use to the VoIP client software.
For the VoIP module to remain passive, there is no other option
than to compute these values for every RTP stream to generate
jitter and packet loss values which will be a good estimate of the
real jitter and loss experienced by both users. This is how, even
in the absence of RTCP stream, we can display a jitter and
packet loss count (and no RTT, and, thus, no MOS).
VoIP views
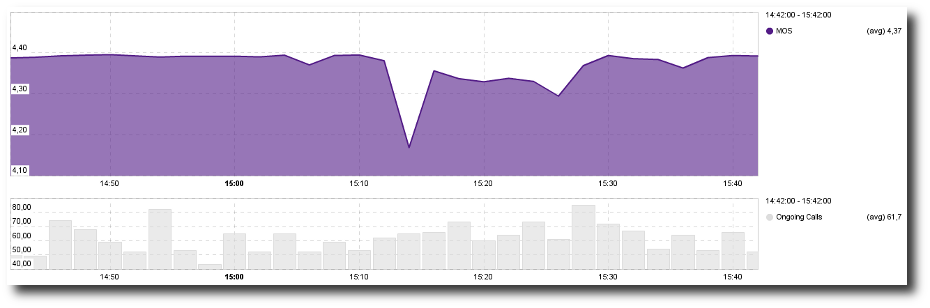
MOS Over Time
This view shows the evolution of the Mean Opinion Score through
time. A second graph shows the evolution of the number of calls to
help you evaluate how many were impacted by a MOS degradation.
- By hovering over a specific point in time on the graph, you can display the exact value for each metric on the right side of the graph.
- By clicking on a specific point in time, you are directly to the VoIP conversations for that time interval.
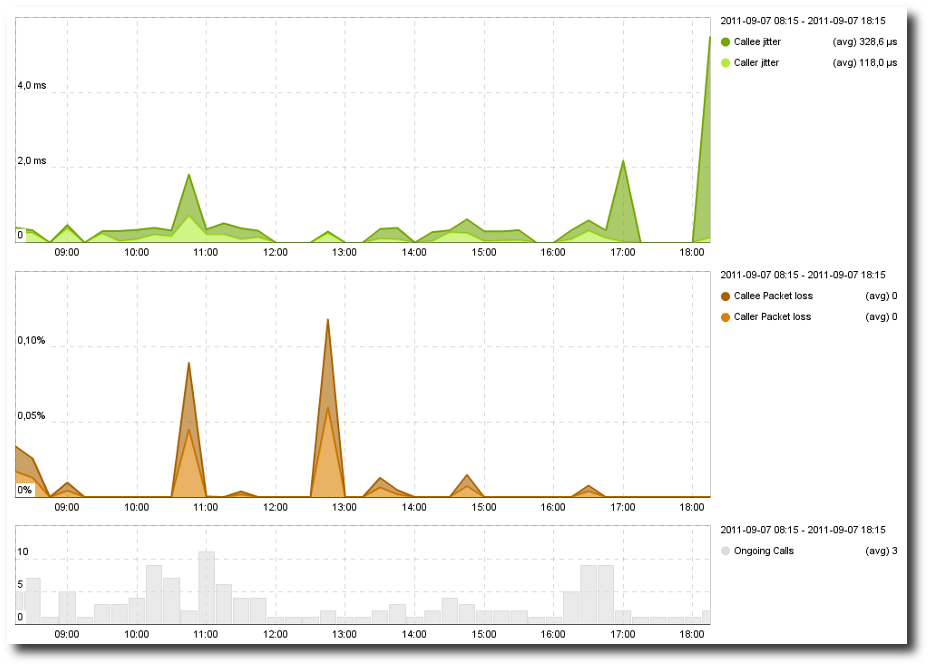
Jitter / Packet Loss
This view shows the evolution through time of the jitter and the
packet loss. This view can help you understand MOS variations and
see which metric is impacting the MOS.
- By pointing a specific point of time on the graph, you can display the exact value for each metric on the right side of the graph.
- By clicking on a specific point of time, you are directed to the VoIP conversations for this point of time.
VoIP Bandwidth & Call Volume
These views show charts for:
- the bandwidth used for voice and signalization.
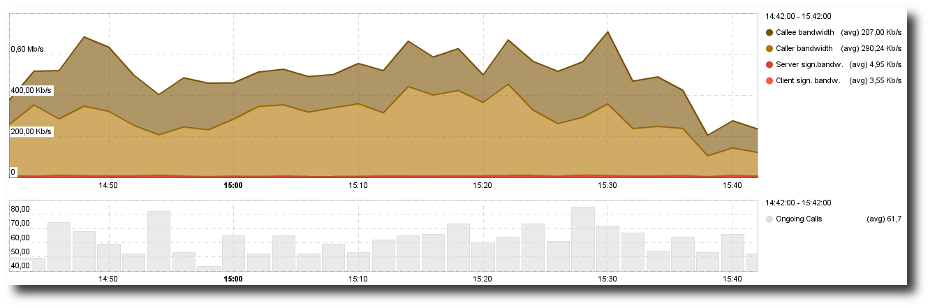
VoIP Bandwidth Chart.
- the evolution of the volume of calls through time. Calls are distributed between successful and unsuccessful calls. Successful calls are conversations where some voice was exchanged; unsuccessful calls are conversations without any voice exchanged.
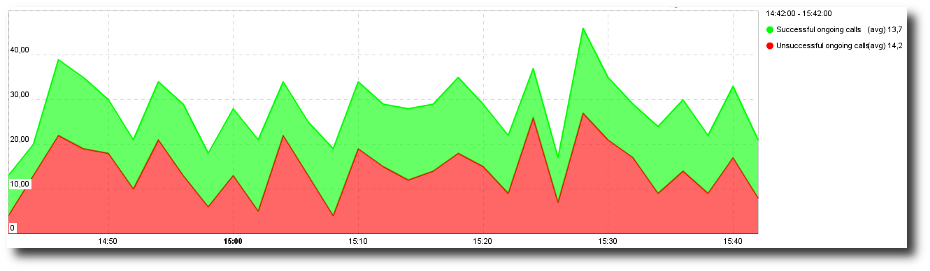
VoIP Calls Volume.
VoIP Conversations & Details
The last two views show each call individually with some usage metrics for VoIP Conversations. The VoIP Flow Details view is the same table with the addition of performance metrics.
Note
The “caller” value corresponds to the metric for the RTP/RTCP
traffic from the caller to the callee, while the “callee” value
corresponds to the metric for the RTP/RTCP traffic from the
callee to the caller.
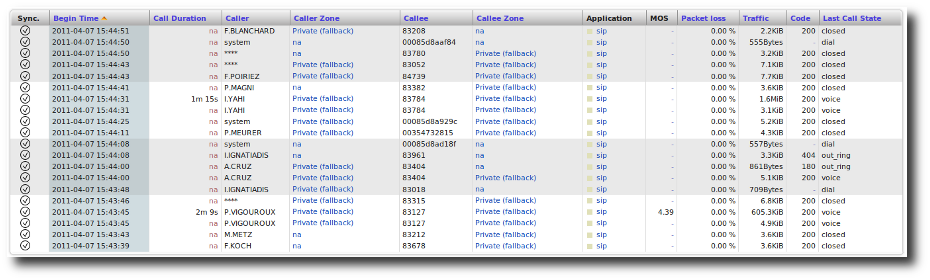
VoIP Calls.
Application Dashboards
A dashboard is a single-screen report that displays relevant information to understand how the application is doing. They are present in APS from version 1.7.
Note
These dashboards are unavailable in SkyLIGHT PVX NPS.
It is extremely useful:
- as a starting point for troubleshooting,
- as a tool to communicate to management and business users on how the application is actually performing.
Section Components will discuss the three components that display these key information.
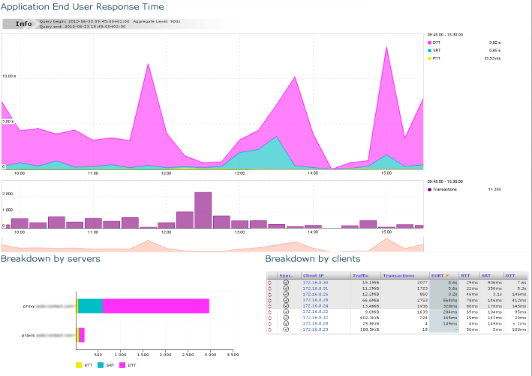
Overall view of the application dashboard.
How can it help?
For reporting
In a single report, you have enough to explain to a business user or a
manager how the application performance went through time, which
servers were doing worse and which zones were impacted. On top of the
EURT, all this is based on three synthetic metrics that are easy to
explain to non-technical people:
RTT– network performance;SRT– server performance;DTT– delivery of application response through the network.
For troubleshooting
For network administrators, this report brings together all of the information about a business application required to:
- validate whether or not there is a slowdown;
- identify the origin of a slowdown (network, application, response delivery);
- which users or servers were impacted.
With one click, you can conclude if there was a slowdown or not, what was the origin of the degradation, which client zones were impacted. With an additional click, you can view whether all clients in a zone were impacted or if the server response time degradation was caused by another application hosted on the same server machine.
Components
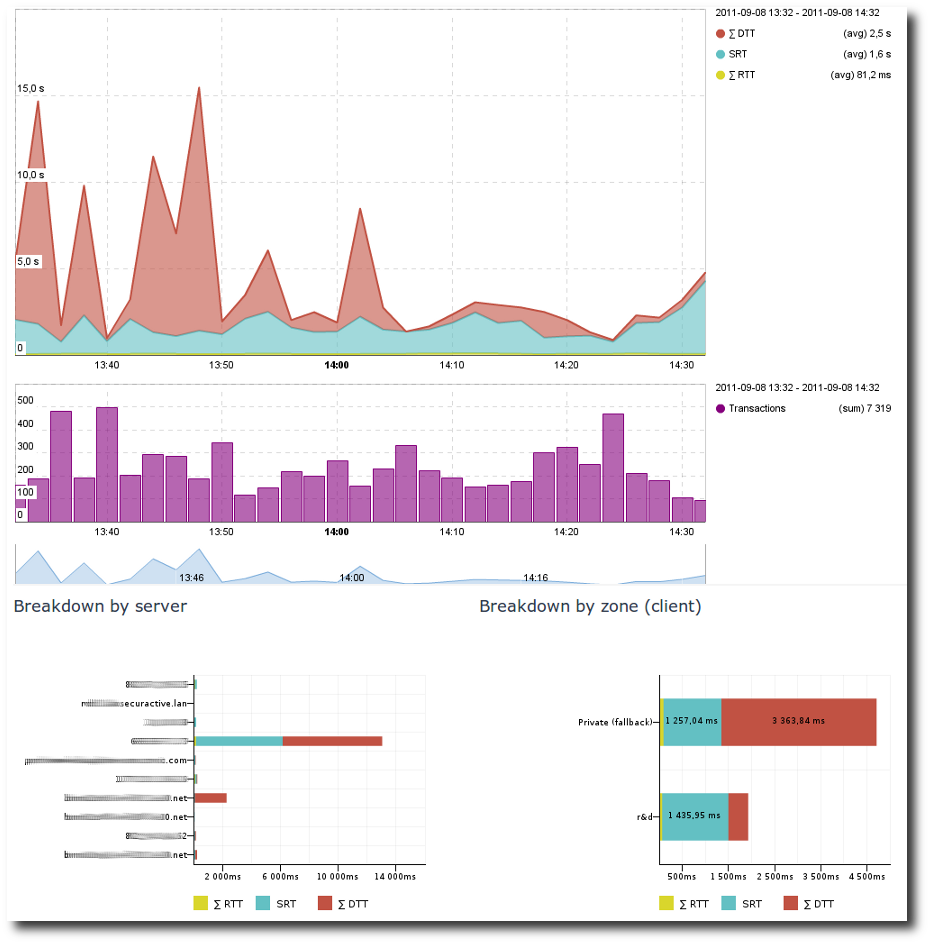
1st element: the evolution of End User Response Time through time
End User Response Time (EURT) graph.
This EURT graph shows:
- the evolution of the quality of experience for users of this application over the period of time,
- the number of transactions which help you consider the evolution of
EURT with rigor and common sense (you would not consider a
degradation of EU Response Time for
10applicative transactions in the same way as for10,000).
The breakdown of EURT into three intelligible components (RTT
for network latency, SRT for Server Response Time and DTT
for Data Transfer Time) lets you know at first glance the possible
origin of the performance degradation. For example, in the screenshot
above, we can observe an increase in the SRT; the network and the
time required to send the response to the client have not increased.
Either the server overall responded slower or some specific queries
required a much longer treatment time (you can determine this by
drilling down to that specific point of time).
2nd element: EURT by Server
EURT by server.
There is a comparison of the EURT on each server that runs this
application. In this case, it is obvious that Atlantis
tends to respond much slower than Brax. By clicking on it and looking
at a second dashboard called Server/Application Dashboard, we shall
be able to determine if this is permanent or punctual and whether
this is due to the load on this application or on another one hosted
on the same server.
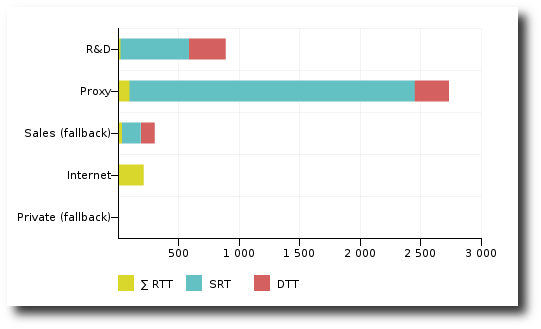
3rd element: EURT by Client Zone
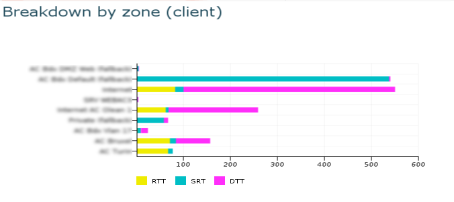
EURT by Client zone.
What we can see here is a breakdown of the EURT for this
application between client zones; with one glance, you can
determine which zone was impacted by the degradation as well
as the different levels of performance depending on the users’
location. In the screenshot above, we can see that mainly one zone
was impacted by the SRT degradation. There are also significant
differences in performance between zones due to differences in
RTT values (network latency).
Drill-down dashboards
SkyLIGHT PVX APS offers two additional dashboards:
- Client zone / Application dashboard.
- Server / Application dashboard.
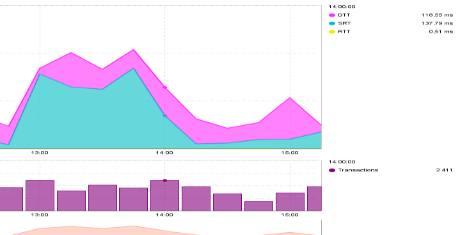
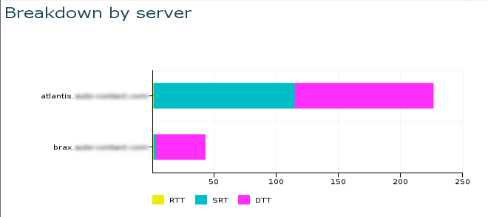
Client zone / Application dashboard
You can access this dashboard either through the menu or by clicking on a specific client zone in the Application Dashboard. This dashboard contains three bits of information:
EURTgraph through time for this client zone and this application.- EURT breakdown by server (so that you can compare the performance offered by different servers for that client zone).
- EURT per client (so that you can identify whether all clients are impacted by a slowdown, or which individual client generates more volume or has worse application performance).
Client zone / Application dashboard.
The breakdown by client lets us know whether all the zone was impacted
or just some individual users, and on which component of the EURT
(network latency, server response time or data transfer time, and for
which number of transaction and amount of traffic).
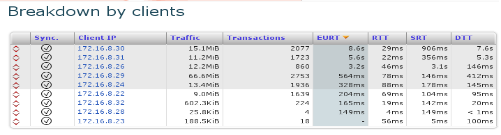
Breakdown by client.
Server / Application dashboard
You can access this dashboard either through the menu or by clicking on a specific server in the Application Dashboard. This dashboard contains three bits of information:
EURTgraph through time for this server and this application- EURT breakdown by client zone (so that you can compare the performance offered to different client zones from that server)
- Comparison with other applications provided by that server (so that you can identify whether a peak of transactions on another application is impacting the performance of that application, and see the volume of data, transactions and performance metrics for all applications provided by this server).
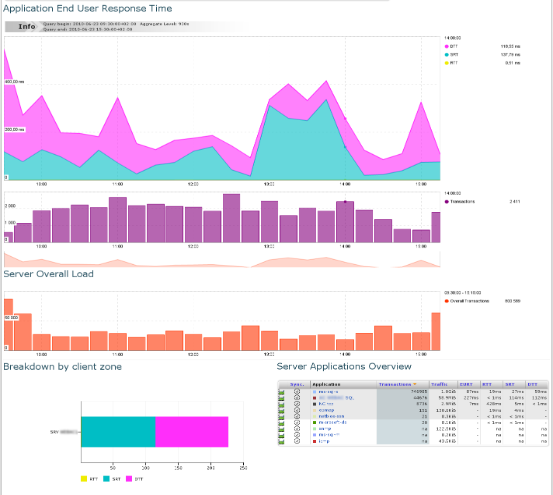
Server / Application Dashboard
Interactions
Dashboards have been developed so that a single click provides more detailed information on the object you are interested in:
- If you click on the
EURTgraph in any of these three dashboards, you make a focus on a shorter period of time. For example, in anSRTpeak, depending on the aggregation level, you either reach a lower aggregation level for a shorter period or the corresponding performance conversations (see Data Aggregation). At the same time, you will get the server and zone breakdown for that more specific period of time. - If you click on a server, you reach the Server / Application dashboard.
- If you click on a client zone, you reach the Client zone / Application dashboard.
TCP Errors / Events
Objectives
The TCP statistics can be displayed in tables by selecting the
appropriate column theme. They can reveal dysfunctions or unusual events.
TCP errors
For each TCP conversation, the following fields are available:
- RD Server/Client
- Duplicate ACKs
- number of SYNs
- number of handshakes
- number of session ends
- number of FINs from the client
- number of FINs from the server
- number of RSTs from the client
- number of RSTs from the server
- number of timeouts
By sorting on the RD or duplicate ACK fields, one can quickly check
the worst conversations in terms of TCP performance. Also,
the number of reset packets is usually noteworthy. One can then jump
to the IP summary page of either the client or the server (depending
on who is to blame) to gather further data on this event.
TCP events
For each TCP conversation, the following fields are available:
- payload
- number of packets
- number of handshakes
- number of timeouts
- number of RSTs from the client
- number of RSTs from the server
- number of FINs from the client
- number of FINs from the server
Packet-Level Analysis
Objectives
Once you have identified the origin of an issue, you may want to analyze it further by looking at the packets themselves. You have two ways to do this:
- Manual packet capture through Pulsar’s
tcpdumpcommand- Automated Packet Capture (AutoPCAP)
- Triggered Packet Capture from the data of a result row.
Manual packet capture
By connecting through Pulsar, you can start a manual capture of any traffic viewed on the interface of your device. To do so, you need:
- Connect to Pulsar (see Pulsar).
- Enter the command to launch the trace: for example,
tcpdump_tofile -i <interface> host <host_ip>. - Enter
Control+Cto stop the trace.
Use the tcpdump command instead of tcpdump_tofile to display
the results of real time packet capture.
Note
- You can access any help by typing
help tcpdump_tofile. - You can refer to the
tcpdumpcommand’s online manual. - All parameters are available except the
-w.
Automated Packet Capture (AutoPCAP)
Principles
SkyLIGHT PVX can capture packets automatically, in case abnormal values are observed on critical servers. These packets are presented for later analysis as PCAP files, which can be downloaded through the web graphical interface at the conversation level.
Applications
These files are presented in the following views:
- Conversations
- DNS messages
- VoIP details
In each of these views, a column at the right end of the table indicates PCAP; a small icon indicates whether packets have been captured for a given conversation or not. If the PCAP file is available, you can download it by clicking on the icon. Once the file has been downloaded, you can view the packets using any protocol decoder capable of reading PCAP files.
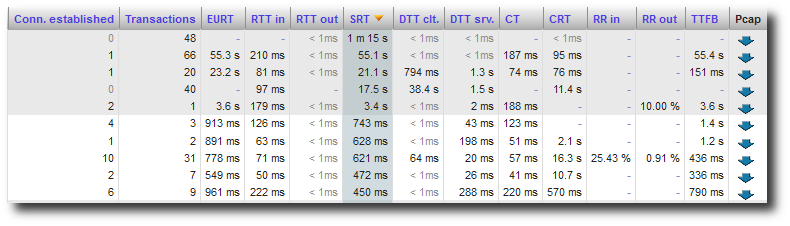
PCAP column in Performance conversations.
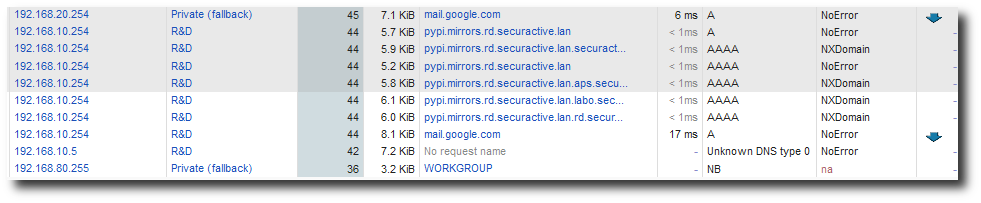
PCAP column in DNS messages.
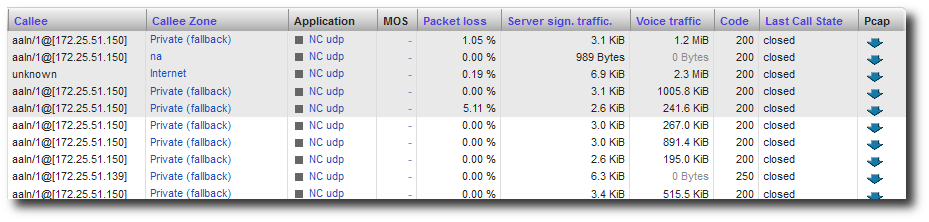
PCAP in VoIP details.
For instance, if you are using Wireshark to decrypt the packets, you can directly view the packets.
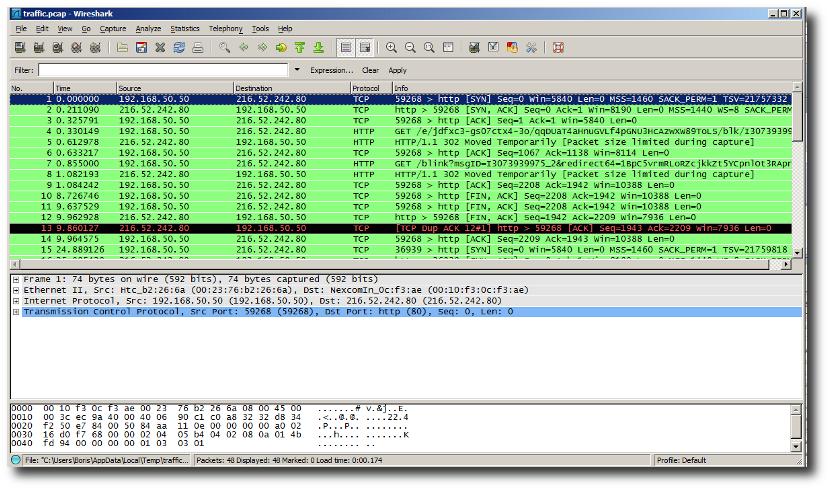
Viewing packets in Wireshark.
To view the query and the beginning of the response, you can use the feature Follow TCP stream (in the Analysis menu).
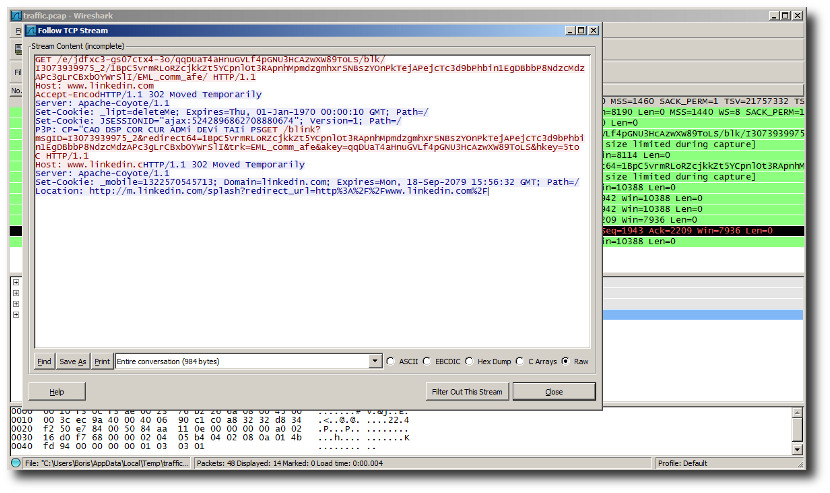
Viewing query and response.
Conditions
Packets are saved by SkyLIGHT PVX as soon as the conversation they belong to matches a certain number of conditions:
- If Capture HTTP is checked in a Zone, and an IP address matches the zone subnet (either as client or server).
- If Capture HTTP is checked in an Application, and a port or an IP address matches the application (either as client or server).
- And one of the following metrics is considered as out of the norm:
- Server Response Time
(SRT)forTCPflows- Retransmission Rate
- DNS Response Time
Note
Why is PVX not used directly in a Zone or an Application to capture PCAP files?
We want to capture the flow for troubleshooting from the very first packet. With only one packet, PVX cannot know what is a Zone or an Application of the flow.
Note
PCAP files are a sample of the conversation. If you request on a one-hour interval and get a PCAP file, the PCAP will not contain one hour’s worth of data but only those that match the above conditions.
Limitations
The Automatic Packet Capture feature works under a certain conditions to ensure the proper execution of other services provided by SkyLIGHT PVX. These necessary limitations include:
- The retention of PCAP files is limited by the disk space allocated for captures; in the current version, this space is limited to 10GB by default (for both manual and automatic captures). When all 10GB are used, no new PCAP file is saved. You can change this value in Sniffer Configuration page.
- The maximum retention time for automatic captures is set to 48 hours; after this delay, PCAP files will be deleted. This cannot be modified.
- The sniffer component of SkyLIGHT PVX is set forge a maximum of 5,000 PCAP files simultaneously; if more than 5,000 conversations are needed, change the parameter in Sniffer Configuration page. Otherwise, some conversations will not be recorded at packet level.
Please note that the threshold values and voluntary limitations in newer versions will be reviewed in light of our experience and the customer feedback that we receive. If you need an exhaustive trace of a given set of conversations, you can also use the manual capture feature available through Pulsar.
Triggered Packet Capture
Triggered PCAPs are generated from the user interface, either by the result rows, or by a configuration page. In both cases, the administrator rights are required.
The setup is very easy because the capture filters are preset with the wanted flow characteristics, but the main advantage of triggered PCAP is that it is possible to set a date and time to start the capture.
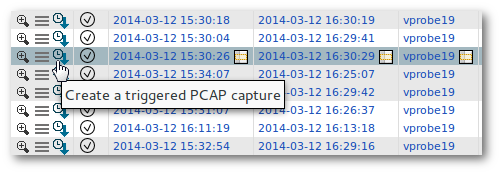
Load the form to trigger a new PCAP; the flow data will be used to preset the filters.
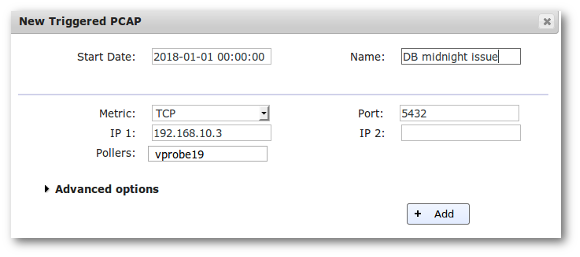
Trigger a PCAP for midnight.
By default, only the local capture is selected to trigger the capture, but all known captures are available. If multiple captures are selected for a capture, then one PCAP will be created for each one.
All added triggered PCAPs are referenced in the dedicated page in the configuration menu. It is possible to delete and download them, regardless of the capture where they were captured.
If a capture was done on multiple captures at a time, then they will have the same name and same filters. They will be grouped together in the management interface.
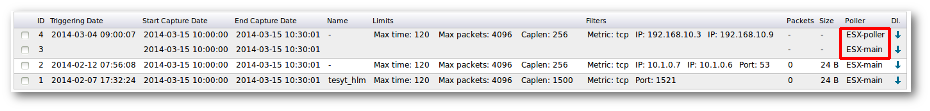
The triggered PCAP management page with the first one created on two captures.
Interpretation Guidelines
The objective of this section is to help our customers make the best use of the performance reports provided by their appliance. You will find a brief overview of how application performance issues can be solved with PVX. This first section focuses on synthetic metrics to produce a measure of the quality of user experience (QoS - End User Response Time) and give you a simple explanatory framework to understand the cause of application slowdowns (Round Trip Time, Server Response Time and Data Transfer Time).
Note
Some metrics and views described below are only available in SkyLIGHT PVX APS.
Objectives
Before you start analyzing performance reports, there are certain
things to keep in mind: Performance metrics should not be
considered as absolute values, but in comparison with different time
intervals, servers and user groups. Performance metrics represent
time interval. Although most of them correspond to the measurement of
a concrete phenomenon, it is almost impossible to provide a scale of
what is a good or a bad response time, with no experience of the
impact it has on users. For example, indicating that the Network
Round Trip Time from a site A to a site B is 200ms does
not mean you have a measure that is acceptable or not. In the same
way, a Server Response Time (SRT) of an application A of
100ms may be very “bad” when the same value would be excellent for
an application B. As a consequence, it is important to consider
performance metrics as relative values. One of the keys to a good
interpretation of performance metrics is to compare systematically
performance metric value with:
- another time period,
- another user group.
Mixing up performance metrics for several applications does not make
sense. When looking at application performance metrics, you should
be very careful of isolating applications for analysis. As a
consequence, the metrics which very much depend on the application’s
specific behaviour should not be considered altogether. This is true
for metrics such as EURT (End User Response Time), SRT (Server
Response Time) and DTT (Data Transfer Time).
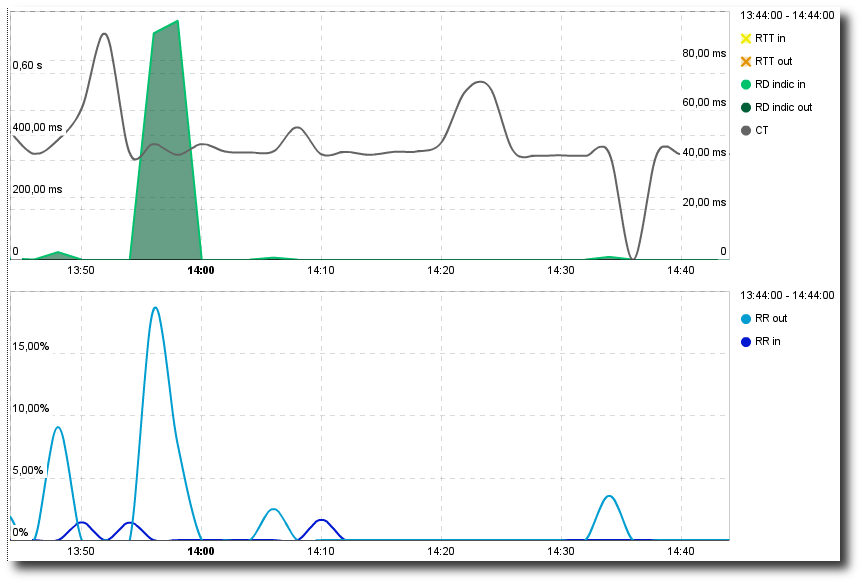
RTT measurements can marginally be impacted by the behaviour of the
operating system. Network Round Trip Times for TCP are based on
the TCP acknowledgment mechanism. This means that, although
RTT is generally a good measurement of round trip latency, if the
operating system of one of the parties is so overloaded that the
acknowledgment process becomes slower, RTT values will be
impacted. RTT Server would be impacted on the server side and
RTT Client on the client side. RTT should then be analyzed in
parallel with CT (Connection Time) because the treatment of a new
session by the IP stack has a higher priority.
Some values are averaged measures. For each conversation, two kinds of values are reported:
- counters, for instance packets or byte counters, which are the sum over all connections aggregated for this conversation;
- performance metrics, for instance
RTT,SRT,DTTand the like, which are average values over all samples aggregated for this conversation.
EURT
EURT stands for End User Response Time.
This metric is an aggregate of various other measures meant to give an
idea of the perceived overall end user experience. It is taken as the
sum of RTT, SRT and DTT.
EURT has no meaningful physical counterpart. Only its evolution
makes sense and allows the system administrator to check at a glance
whether a network zone is behaving as usual or not. Notice that
expected correct values for both SRT and DTT depend on the
protocol at hand. As a consequence, you should not try to compare two
EURTs of different applications.
RTT
RTT stands for Round Trip Time.
RTT gives an approximation of the time required for a packet to
reach its destination, and can be further decomposed into an
RTT Server (delay between a data packet send by the client and its
ACK from the server) and an RTT Client (in the other way
around). As a typical IP implementation will delay acknowledging of
incoming data, additional tricks are exploited in order to rule out
these software biases:
- make use of
SYN/FINacknowledgment and some exceptional conditions such asTCPresets, that suffer no such delays, to estimate a realistic upper bound. - exclude unusually high
RTTvalues. - bound
RTT Server/ClientbySRT/CRTifRTTsample set looks suspicious.
RTT is refers to the bare speed of the physical layer. It is
unaffected by packet retransmissions, packet loss or similar
occurrences. RTT may be affected by (from most common to the
rarest):
- Slow network equipment between client and server (such as a router or a switch);
- Link layer overloaded (ethernet collisions, for instance);
- Malfunction of one of the involved network adapters.
These troubles should be further investigated by comparing with other
client and/or server zones in order to locate the misbehaving
equipment. Notice that a degradation of RTT will almost invariably
impact other metrics as well.
SRT
SRT stands for Server Response Time.
SRT gives an estimation of the elapsed time between the last
packet of an applicative request and the first packet of the server’s
response.
SRT represents the processing time of the server, at the
application layer, for a given request. SRT may be affected by
(from the most common the the rarest):
- Time-consuming application request (a complex
SQLcommand can let the server process longer); - Application layer overloaded (too many requests that the server can’t handle in a small period of time);
SRTcan be marginally affected by the increase of network latency between the point of capture and the server (parallel increase of theRTT Servervalue).
To pinpoint the root cause of the slowdown, we want to compare the
SRT for a given server/application with other applications on the
very same server. If there is a blatant difference, the application
is guilty. Otherwise, we want to compare it with other servers in
the same zone, then different zones.
DTT
DTT stands for Data Transfer Time.
DTT server is defined as the time between the first data packet of
the response (with ACK flag and a non-nil payload) from the server
and the last packet considered as part of the same response (if the
packet has the same acknowledgement number); FIN, RST packets
from server or client will also be considered as closing the sequence.
A Timeout will cancel a DTT. Note that if the answer is small
enough to be contained in only one packet, the DTT will be
'0'.
DTT client is the same metric in the other direction.
DTT (sum of both server and client DTT) is the time the user
is going to wait for the response to circulate on the network from the
server to the client. It does not depend on the Server Response Time
(e.g., a DTT might be short for a long SRT:
- the request might require a large calculation, but the result
represents a small volume of data; or a
DTTmight be very large, butSRTis very short because the request is easy to handle yet the response is very large).DTTdepends on (from the largest impact to the smallest): - the size of the response (the more data is contains, the longer it takes to transfer it),
- the level of retransmission (the more packets are retransmitted, the longer it will take to transfer the whole response),
- the network latency (the longer it takes to transfer packets through the network, the longer it will be to transfer the response - minor impact),
- the actual throughput that can be reached to transfer the response from the server to the client.
DTT may vary (from most common to the rarest):
- globally or on a per transaction basis (if only some transaction is impacted, it may be linked to the size of some specific application response),
- for all or some client zones (if only some client zones are impacted, it may be linked to specific network conditions — retransmissions),
- for all or some servers (if only a specific server is impacted, it may be due to a specific server issue in broadcasting the response).
Scenario guidelines
Slow site connection
Hypothesis:
One or several end users complain about a slow access to all applications (both in and out the LAN).
Diagnosis:
You will find in this section the classical information to grab in order to diagnose the issue:
is the application really slower for this site? You can get this information from the Application Performance Dashboard:
Zone comparison in the Application Performance Dashboard.
Does the slowdown occur for a specific application? If so, check Slow application.
Does the slowdown occur for a specific server? If so, check Slow server.
EURT comparison between servers in the Application Performance Dashboard
Server Response Time comparison through Server Performance.
Did you upgrade the clients workstations recently? If so, it’s a specific system issue. You may ask the System Administrator for more details.
Did you upgrade your network equipment? If so, the router/switch configuration is probably involved.
We may do an in-depth inspection of the PV dashboards. Check the Monitoring -> Performance Over Time Chart
Network Round Trip Time analysis
Do the Retransmission Rate and Retransmission Delay vary? If so, we might face a congestion issue. Take a look at the router’s load, etc.
Retransmission analysis
Retransmission analysis
The general slowdown for a client zone may also be the consequence of a crucial service: the
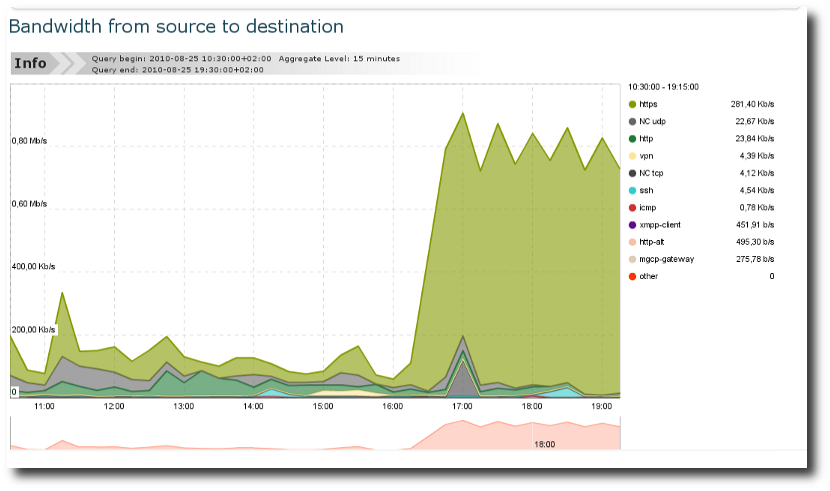
DNS. Check out DNS Response Time.Look at the Monitoring -> Bandwidth Chart to inspect the bandwidth variation, and the number of
TCP/UDPflows as well.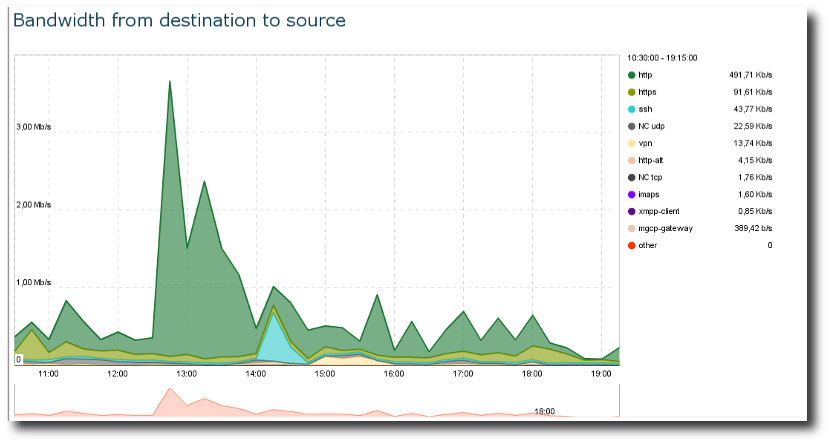
Bandwidth charts
Impact of congestion on retransmissions and network latency or connection time
They might have overcome a QoS threshold, such that all new application requests are blocked. A hint would be the increasing number of TCP RST packets. To be sure, you may dive into the Analysis -> TCP Errors menu.
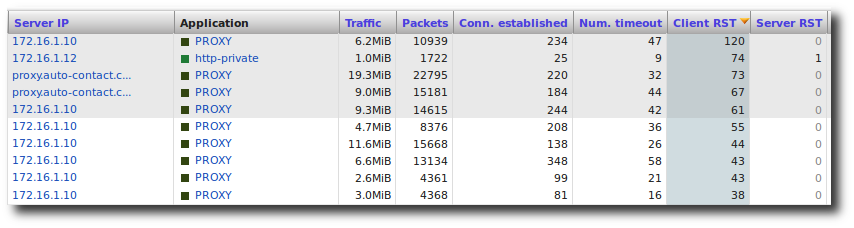
Number of RST packets sent from the TCP servers
Slow application
Hypothesis
One or several end users complain about a slow access to a specific application – a fileserver.
Prerequesites
Zones have been configured to reflect the customer’s network topology.
The application Samba_CIFS has been identified. The traffic to the
fileserver is mirrored to one of the listening interfaces of the
probe. Where to start: a global view of the application performance!
1st example
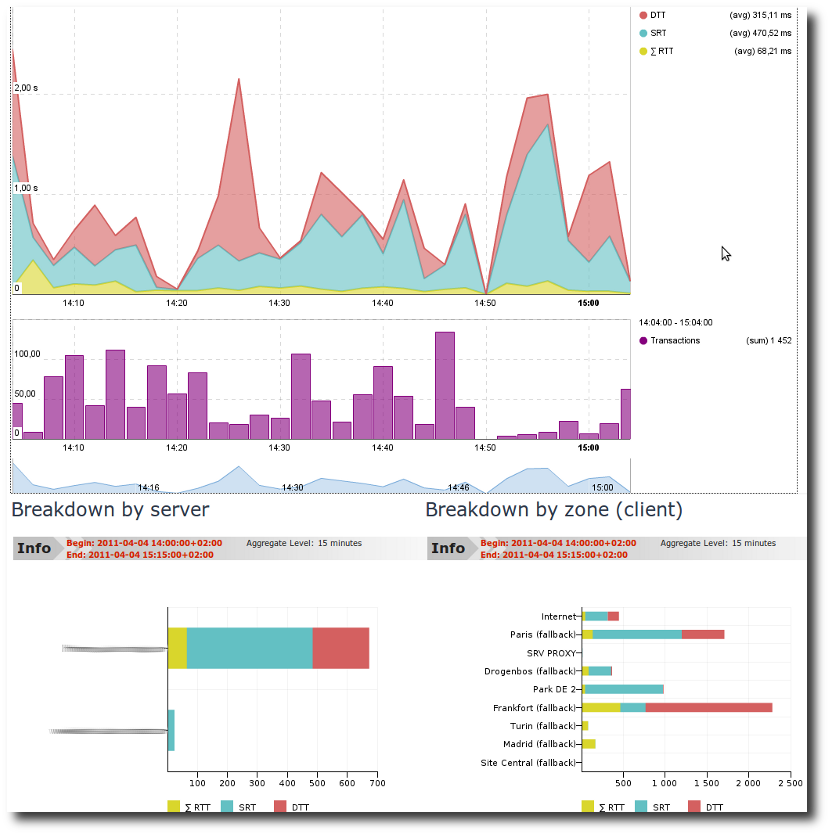
Peak in Server Response Time: application performance
Display the Application Dashboard for a relevant period of time. We
can easily observe a peak in SRT from 6 to 18:15. From the
breakdown by zone, we can easily conclude that only one zone has been
impacted.
Peak in server response time: Application EURT
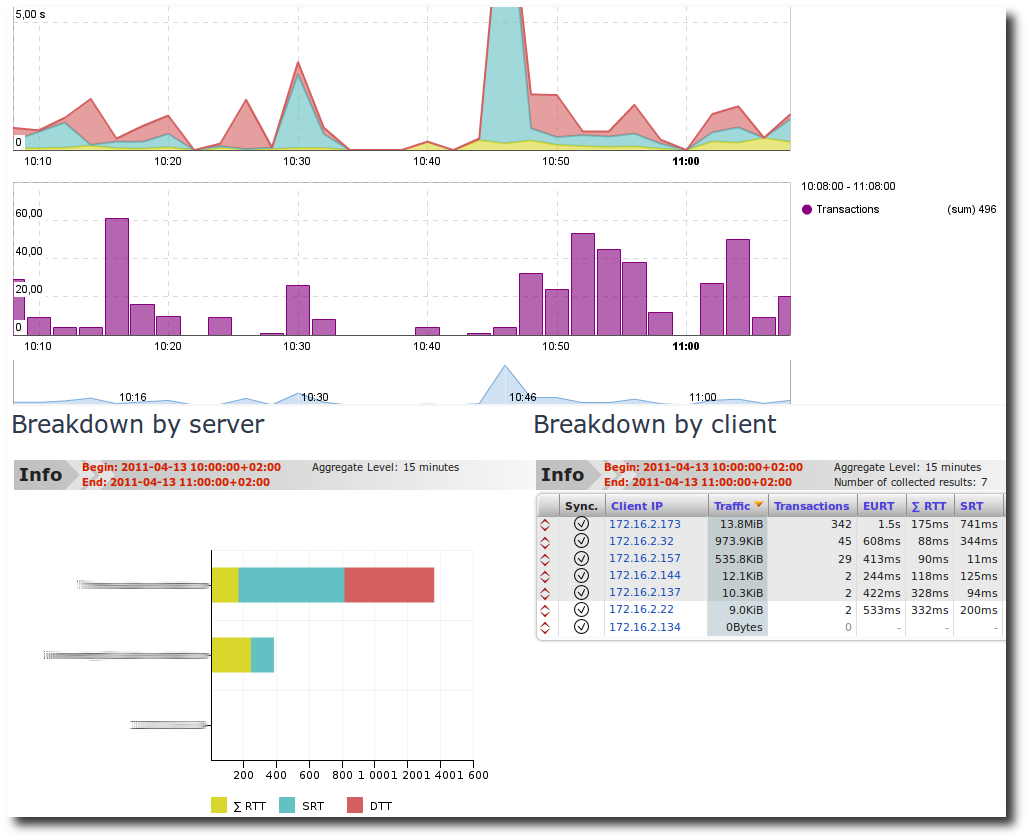
By clicking on that zone, we can see this client zone’s application dashboard:
From this, you can conclude that only one client (= user) was impacted. This issue was definitely due to a slow response of the server; it may be due to an application issue or a request which is specifically hard to respond to.
2nd example
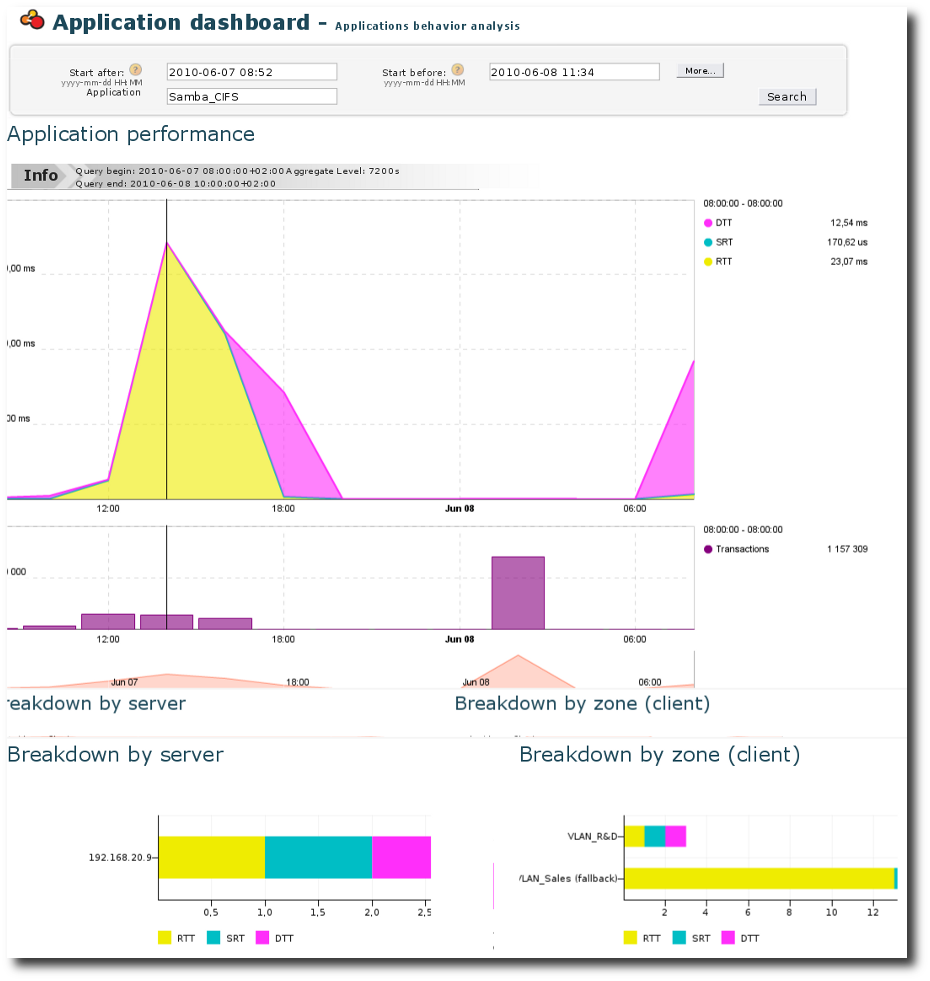
Peak in server response time: Application dashboard
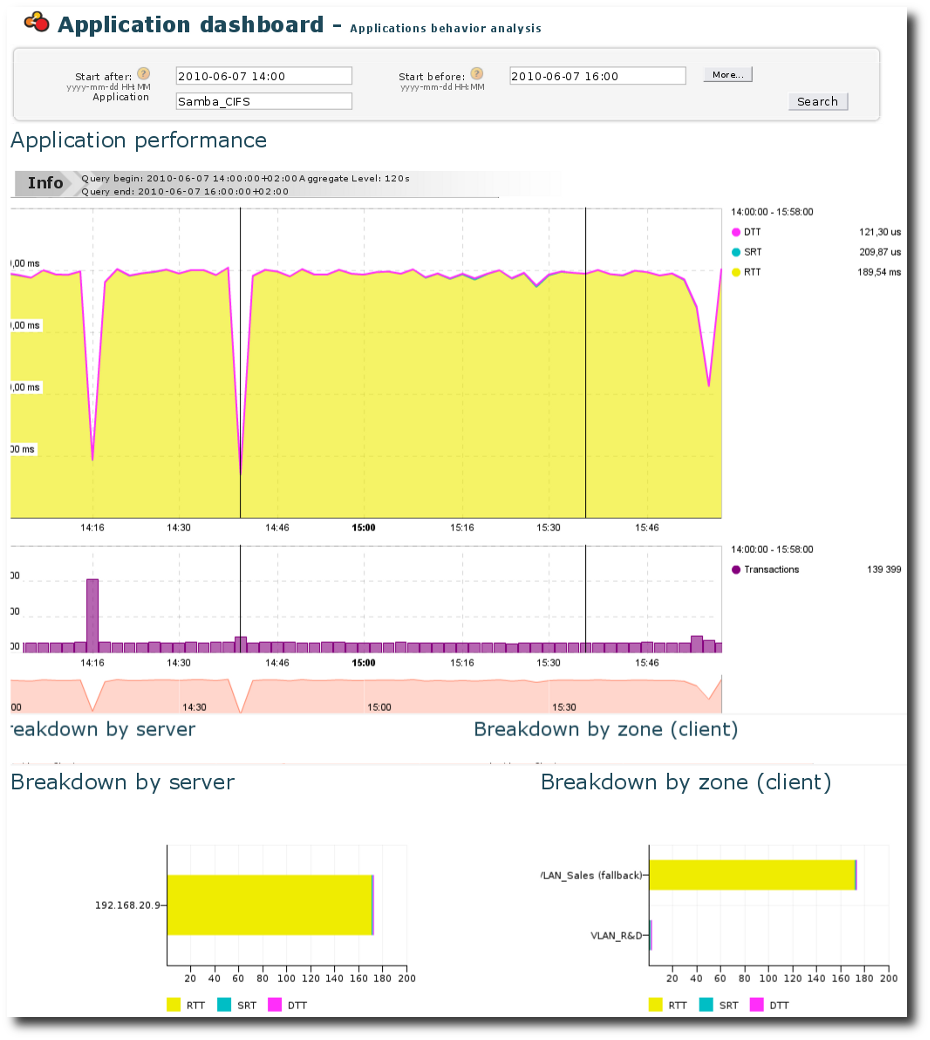
Inspect the Application Dashboard for a relevant period in the past (48 hours for example).
This dashboard shows in the upper part the evolution of the End User
Response Time (EURT) through time for this fileserver.
- We can easily observe that the quality of experience of users accessing this application got much worse yesterday afternoon.
- We can easily identify that this was due to a degradation of
RTT(Round Trip Time - indicator of network latency) and not to the Server Response Time(SRT)or the Data Transfer Time(DTT).
From this graph, we can conclude that the server and the application are likely not related to the slowdown. By looking at the two bar charts which show the breakdown by server and by client zone, respectively, we can draw the following conclusions:
- This application is distributed by one server only
(192.168.20.9). - The
EURTvary in large proportion between client zones, mainly because ofRTT. - VLAN_Sales has a much worse access to the application than VLAN_R&D, mainly because of the network latency.
To confirm our first conclusions, click on the peak of EURT in
the upper graph. We can narrow our observation period to understand
better what happened at that point of time.
Peak of RTT in Application Dashboard
This confirms the following conclusions: RTT went up for the
VLAN_Sales (only).
Understanding the perimeter of the slowdown
We now know that only VLAN_Sales was impacted by this slowdown, due
to a longer network RTT. We, therefore, need to understand whether
this was general (i.e., impacted all clients in the zone) or isolated
to certain clients.
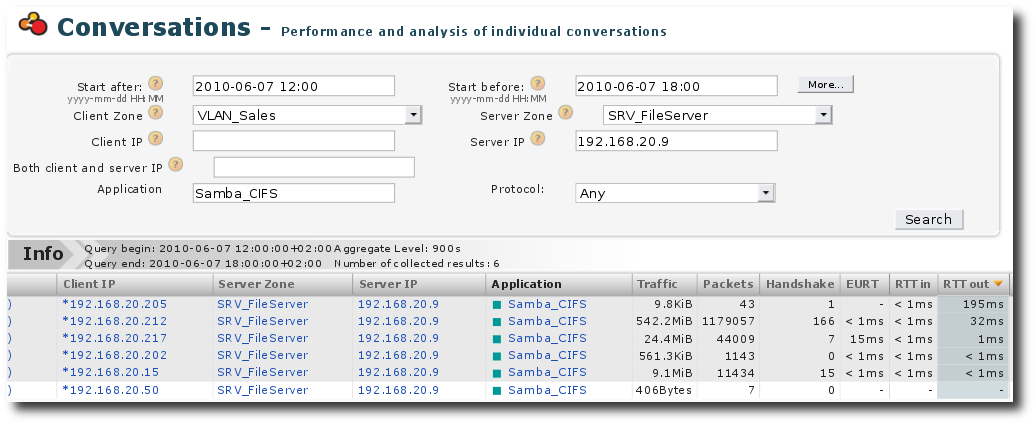
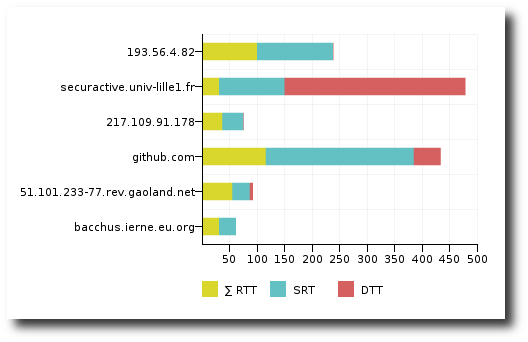
Peak in server response time: Conversations
To achieve this, we can simply display the Performance conversations for the application Samba_CIFS for the zone VLAN_Sales.
From this screen, we can draw the following conclusion:
Only the clients 192.168.20.205 and 192.168.20.212 seem to be
impacted. The other clients have very short RTT values.
Peak in server response time: Conversations
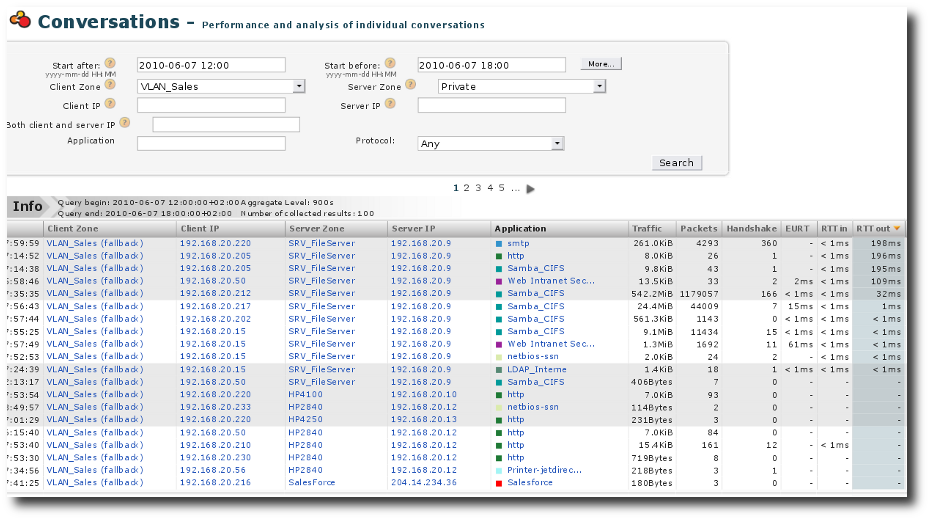
To confirm this, we need to check that these two hosts are the only ones impacted and check whether they were impacted only when accessing the Fileserver. To do so, we look at the Performance conversations between the VLAN_Sales and the Private zone. From this, we can draw the following conclusions:
- Not only
192.168.20.212and192.168.20.205, but also192.168.20.220and192.168.20.50were impacted. - The Samba_CIFS (access to the fileserver) was not the only
impacted application;
SMTP,HTTPand the Web Intranet SecurActive were also impacted.
Actions to be taken after that analysis:
- Check the windowing configuration on the operating system of these hosts (if high value, this is normal).
- Check the level of usage of the host (CPU, RAM usage).
Alternative scenarios:
- If we had seen some retransmissions, check whether they are all on the same edge switch and check the interface configuration and media errors.
Slow server
Hypothesis:
Users complain about having to try several times to connect to a web-based application named “Salesforce”. The administrator suspects the application server hosting “Salesforce” is slow.
How to analyze the problem:
First, check to see if all applications on the application server
hosting “Salesforce” are slow or if it is just that particular
application. If all applications are slow, then the application
server may, in fact, be a slow server. If just the one web-based
application “Salesforce” is slow, while the other applications
(CRM) are responding quickly, the problem may be the application.
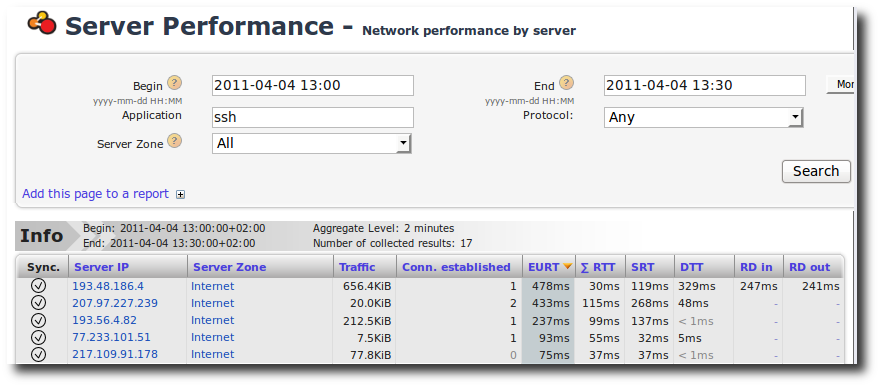
To begin diagnosis, go to “Monitoring” -> “Clt/Srv Table”. Select the application server from the drop-down box labeled “Server Zone” and click “Search”.
- If we see that all applications on the server are responding slowly,
i.e., the
SRTvalues are high for both “Salesforce” and “CRM”, the issue is related to the server, not to applications. - Second, check the Connection Time of the application server. If the connection times are high, then this may also indicate a slow server.
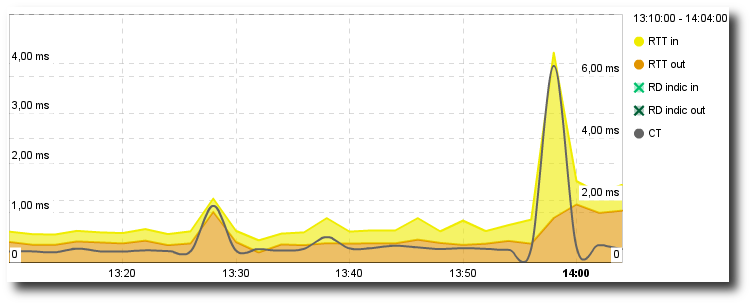
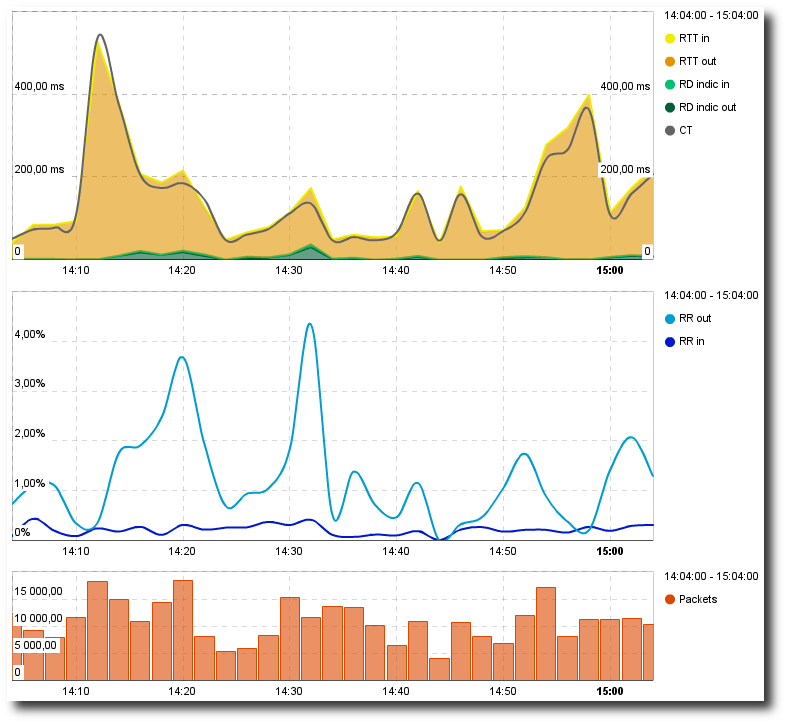
- Third, check for retransmissions between the clients and the application server. If there are a lot of retransmissions, then either the application server or a network device in between are dropping packets. Go to “Monitoring” -> “Performance Over Time chart”. Select the application server “Salesforce” from the drop-down box labeled “Server Zone” and click “Search”.
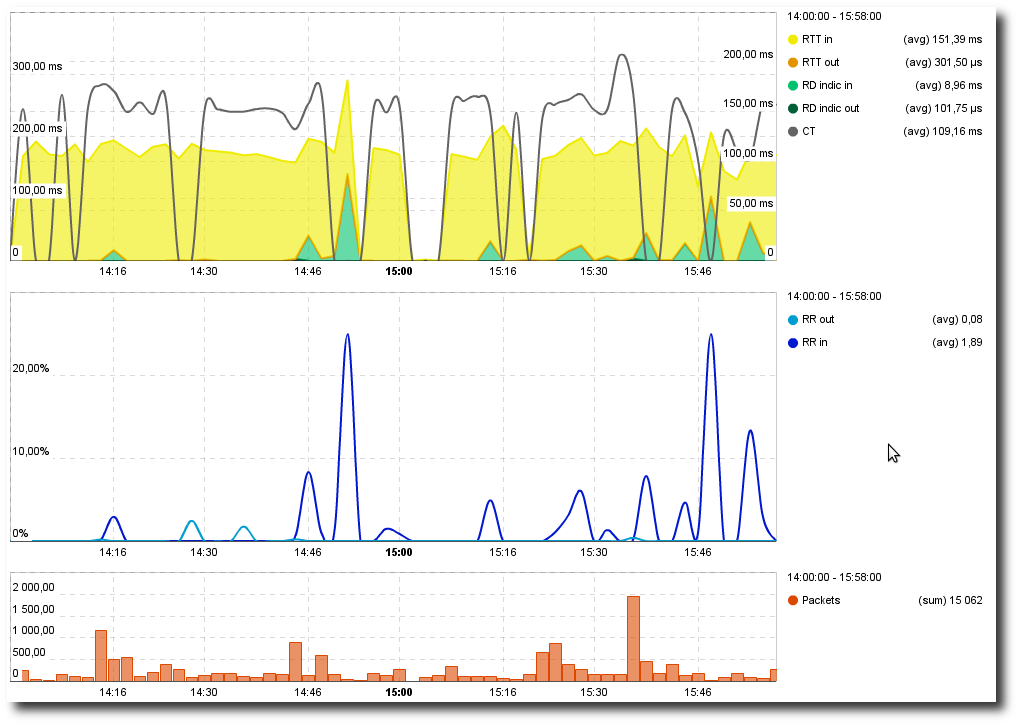
Slow server: Performance Over Time chart
Here, we see that there is a high Retransmission Rate (RR Server)
going from the clients to the application server. However, none of the
packets from the server to the clients needed to be retransmitted
(RR Client is around 0). This indicates that the application
server is, in fact, dropping the packets and is therefore a slow
server (assuming that the route taken from the client to the server is
the same route taken from the server to the client as is industry
standard practice).
Lastly, check the TCP errors of the clients and the Application server. If the server reset count or number of timeouted sessions is high, this is a further indication of a slow server. Go to Analysis -> TCP errors. Select the application server “Salesforce” from the drop-down box labeled “Server Zone” and click Search.
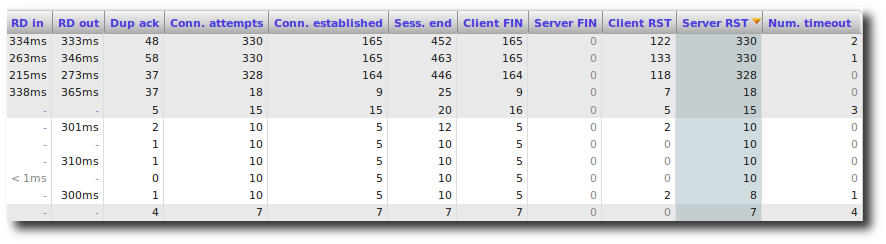
Slow server: TCP Errors
Here, we see that there are a lot of server resets and timeouts. Given all the above information, we can conclude that the application server is operating slowly. At this point, the server administrator should perform direct diagnosis on the application server to verify CPU, RAM and HD usage.
N-tier application performance issue
Hypothesis:
Users are complaining about slow response time from an in-house web application. This application being an N-tier architecture, its performance as seen by a client is tied to several parameters:
- DNS latency to resolve web server name from the client host (see DNS Response Time)
- Connection time to server
- Data Transfer Time between these hosts
- DNS latency to resolve other server names accessed from the web server (database servers for instance, see DNS Response Time)
- Connection and data transfer times between these hosts
- Server response time of these servers
Identifying the culprit:
First, we need to find out if the experienced slowdown is due to the
web front-end itself. To this end, check every component of the
EURT:
- If
SRTis fast butRTTand/orDTT(see also Connection Time), then we are facing a network slowdown. Refer to previous sections of this guide to further track down the problem. - If
SRTis preponderant compared toDTTandRTT, then the application itself is to blame. Proceed to find out what is affecting performance. - Then check the
EURTbetween web server and each other involved servers (databases, etc.)
If some of these EURTs appear to be degraded then check
recursively these other hosts. If not, then check the web server’s
load average.
Additional metrics
TCP anomalies
RST packets
A TCP connection is reset by an RST packet. There is no need
to acknowledge such packet; the closure is immediate. An RST
packet may have many meanings:
- If a
TCPclient tries to reach a server on a closed port, the server sends anRSTpacket. The connection attempt could be a malicious one (port scanning – NMAP, etc.), or the consequence of an unexpectedly down server, client/server misconfiguration, server restart, etc.; - A router might send an
RSTpacket if the incomingTCPpacket does not fit with the security policy (source range IP address is banned, the number of connection attempts is too high in a small period of time, etc.); - A QoS (Quality of Service) equipment limits the bandwidth (or the
number of connections) by sending an
RSTpacket to any new connection attempt; - If an Intrusion Detection System (e.g., Snort) detects a malicious
connection, he can send an
RSTpacket to roughly close it; - If a host between Client and Server wants to do a Denial of Service,
it can reset the connection by sending
RSTto both peers. Basically, it’s the same mechanism as the previous one, but the motivation is quite different.
Retransmissions
One of the TCP metrics that is interesting to analyze is the
retransmission. A TCP Retransmission is when a TCP packet is
resent after having been either lost or damaged. Such a retransmitted
packet is identified thanks to its sequence number. In
SkyLIGHT PVX, we do not consider packets with no payload, since
duplicate ACKs are much more frequent, and not really characteristic
of a network anomaly. There are several common sources for TCP
retransmission:
- A network congestion. If a router can’t cope with the whole traffic,
its queue will grow bigger until it gets full and then starts
dropping the incoming packets. If you reach a predefined QoS limit,
the exceeding packets will be dropped as well. Such drop will result
in a
TCPretransmission. A common way to identify this kind of problems is by taking a glance at the traffic statistics. If you see a flat line at the max traffic allowed, then you get the root cause of retransmission. If the traffic graph looks OK, you can check the load of the routers/switches you own (e.g., with theSNMPdata). If the load is too high, you found the culprit. - An overloaded server. Check the Section Slow Server.
- A hardware failure. Maybe a network equipment is simply down. It
will obviously result in
TCPretransmission until a new route is computed, or the issue fixed. This type of retransmission should occur with very short time effects and give some quite big peaks of retransmission, on very broad types of traffic on a specific subnet. If this happens often, it becomes important to find the faulty hardware by tracking down which subnets are concerned. - A packet header corruption. Network equipments are used to rewrite
portions of packets (Ethernet source/destination, IP checksum, maybe
TOS field). A buggy firmware can result in corruption while
rewriting protocol headers. In this case, the packet will probably
be dropped within the network route. Even if it reaches the
destination, the
TCP/IPstack won’t consider it as a valid packet for the currentTCPsessions, and the stack will wait for the correct packet. It will end in aTCPretransmission, anyway. This problem will likely occur on the same type of traffic and continuously.
ICMP
What is ICMP?
ICMP stands for Internet Control Message Protocol and is also a
common IP transport protocol. It seems pretty explicit, although most
people reduce ICMP to ping reply commands, it is a good way to test
whether a host can be reached through a network and how much it takes
for a packet to make a round trip through the network. Obviously, ping
and trace-route-like tools are very useful for network administrators
but there is much more to say about ICMP and the help it can
provide for network administration and diagnosis. ICMP can be used
to send more than twenty types of control messages. Some are just
messages; some others are a way for IP devices or routers to indicate
the occurrence of an error.
Error messages
Let’s describe the most typical ICMP error messages you can find
on networks.
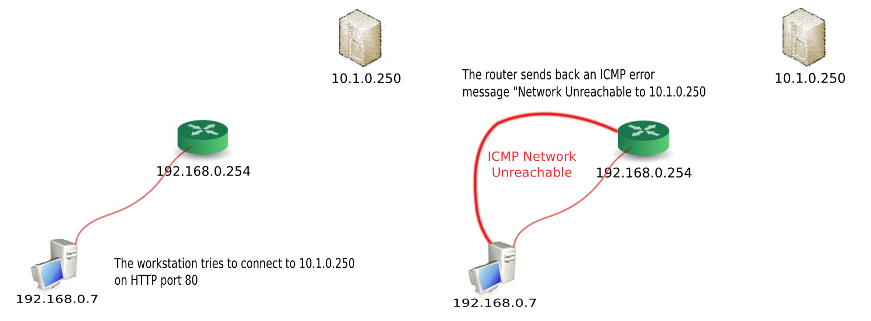
ICMP Network Unreachable
Let’s take the simplest example: one machine sitting on a LAN
(192.168.0.7), has one default gateway (192.168.0.254) which
is the router. It is trying to reach a server, which does not sit on
the LAN (10.1.0.250) and which cannot be reached because
192.168.0.254 does not know how to route this traffic.
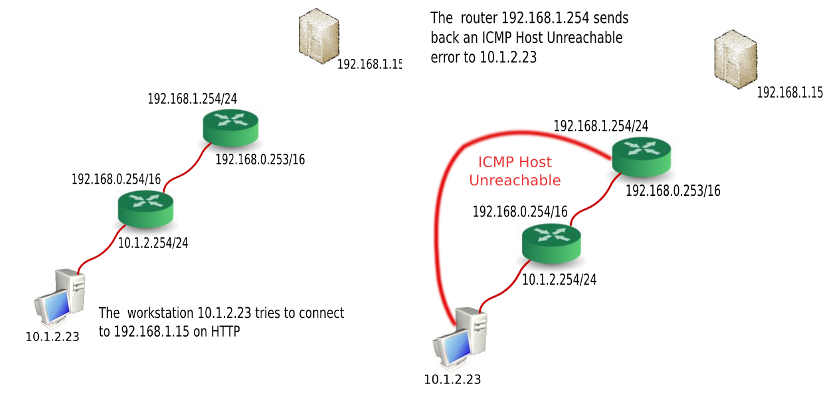
ICMP Host Unreachable
Let’s take the simplest example: one machine sitting on a LAN
(10.1.2.23), has one default gateway (10.1.2.254/24) which is
the router. It is trying to reach a server which does not sit on the
LAN (192.168.1.15). The traffic flows and reaches the last router
before the server (192.168.1.254/24); this router cannot reach
192.168.1.15 (because it is unplugged, down or it does not exist).
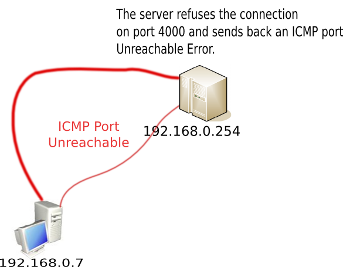
ICMP Port Unreachable
Let’s take a second example: one machine sitting on a LAN
(192.168.0.7). It is trying to reach a server 192.168.0.254,
which sits on the LAN on port UDP 4000, on which the server does
not respond.
Where is the challenge with ICMP?
You may be tempted to say: if it is that simple, why do we need
SkyLIGHT PVX on top of any sniffer? All the information sits in
the payload. But in every network, you will find some ICMP errors.
They may be due to a user trying to connect to a bad destination, or
trying to reach a server on the wrong port. The key is in having a
global view of how many errors you have normally and currently and
from where to where. The key to leveraging ICMP information is in
having a relevant view of it and understanding what it means.
How can ICMP help in network diagnostic and security monitoring?
By analysing ICMP errors, we can identify machines that try to
connect to networks or machines that are routable from the LAN’s
machine or ones that try to connect on actual servers but for
services whose ports are not open. Here are some examples of
phenomena that can be identified that way:
Misconfigured workstation
A workstation repeats a large volume of missed attempts to connect to a limited number of servers: it may be that this machine does not belong to the company’s workstations (external consultant on the network whose laptop is trying to reach common resources on his home network – DNS, printers, etc.), or it may be the machine of someone coming from a remote site with its own configuration or a machine that has been simply wrongly configured.
How would we see it?
A large number of ICMP Host Unreachable errors coming from one or
several routers to this machine or this group of machines. The
ICMP information contained in the payload of each of these errors
would probably show they are trying to reach a certain number of hosts
for some services or applications.
Migration legacy
A certain number of machines keep requesting DNS resolution to a DNS
server that has been migrated (this could be true for any application
available on the network). Their users certainly experience worse
performance when trying to use these services.
How would we see it?
A large number of ICMP Host Unreachable errors coming from one or
several routers to a group of machines. The ICMP information
contained in the payload of each of these errors would probably show
they are all trying to reach the previous IP address of a given
server.
Network device misconfiguration
A router does not have a route configured; some machines are trying to reach some resources, unsuccessfully.
How would we see it?
A large number of ICMP Network Unreachable errors coming from one router to many machines. The ICMP information contained in the payload of each of these errors would probably show they are all trying to reach the same network through the same router.
Port scanning
A machine is trying to complete a network discovery. It is trying to connect to all servers around to see which ports are open.
How would we see it?
A large number of ICMP Port Unreachable errors coming from one or several routers corresponding to a single machine (the one which is scanning).
Spyware / Worms
An infected machine is trying to propagate its spyware, virus or worm throughout the network; obviously, it has no previous knowledge of the network architecture.
How would we see it?
A large number of ICMP Host Unreachable errors coming from one or several routers corresponding to a limited number of hosts, trying to reach a large volume of non-existing machines on a limited set of ports.
Server disconnected/reboot
A service on UDP (DNS, Radius...) is interrupted because the
server program is temporarily stopped or the host machine is
temporarily shutdown. Many requests are then discarded.
How would we see it?
Many ICMP Port Unreachable messages (preceded by some unreachable host if the host itself was shut down) are emitted during a short period of time for this service host/port.
DNS Response Time
Background:
The DNS (Domain Name System), which has been defined in detail in
the RFC 1034 and RFC 1035, is key to the good performance of
TCP/IP networks. It works in a hierarchical way. This means that
if one of the DNS servers is misconfigured or compromised, the entire
network, which relies on it, is also impacted. Although the DNS
protocol is quite simple, it generates a significant number of issues:
configuration issues, which affect the performance of the network as
well as security issues, which jeopardize the network integrity. The
purpose of this section is to cover the main configuration issues you
may encounter with DNS when it comes to network performance.
Hypothesis:
You noticed a general slowdown for a specific host, zone, or the entire LAN. You didn’t find the issue with the previous methods. Maybe this problem has nothing to do with the business applications or your network equipment.
Diagnosis:
The DNS server(s) need to have a very high availability to resolve
all the names into IP addresses that are necessary for the
applications on the network to function. An overloaded DNS server
will take some time to respond to a name request and will slow down
all applications, that have no DNS data in their cache. An
analysis of the DNS flows on the network will reveal some
malfunctions like:
Latency issues
If we can observe that the mean time between the client request is
significantly higher than the average (on a LAN it should remain close
to 1 ms), we may face three kinds of issue:
- the client is not requesting the correct
DNSserver (DHCPmisconfiguration, for example). You can check this out in the interface by looking at the Server IP fields; - it means that the
DNSserver has an issue with regards to the caching ofDNSnames. The cache system makes it possible to resolve a name without requesting theDNSserver, which has authority for the DNS zone, the IP address corresponding to the name. Hence, if the response time is high, first the application will be slow from the user’s point of view and secondly, it will include an unnecessary consumption of bandwidth. This bandwidth will be wasted both on the LAN and on the Internet link (if we make the hypothesis that the authority server sits on the Internet). If we consider the case of a fairly large organization, the bandwidth used by the DNS traffic will not be negligible and will represent an additional charge; - the
DNSserver may have system issues. If the server is overloaded, it cannot hold all the requests, and delay (or drop) some, which leads to a general slowdown of the network perfomances.
You can easily cast a glance at these issues: go in the Analysis -> DNS Messages menu, and fill the form with appropriate values (especially the Requester Zone), to verify that the requests are correctly answered, and in an acceptable timing.
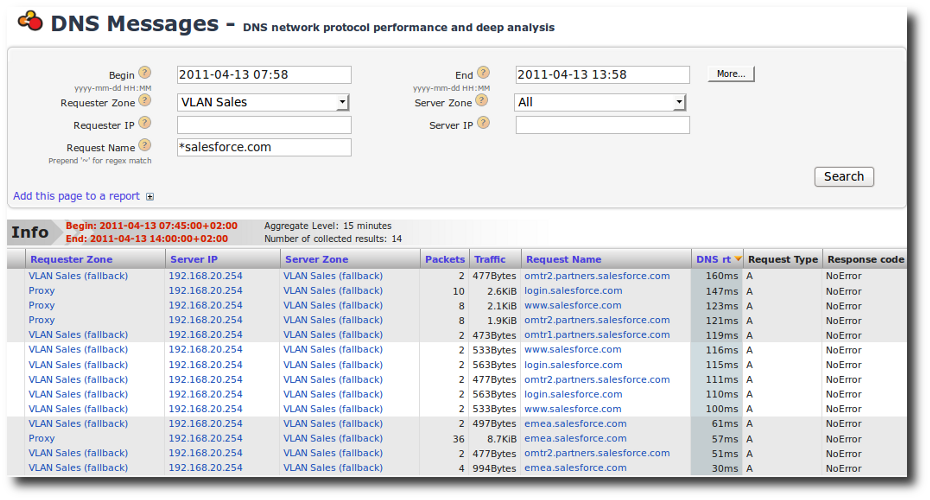
DNS Response Time for a specific requester zone (here, VLAN_Sales)
Traffic issue
If we establish the top hosts making DNS requests, it will be
possible to pinpoint misconfigured clients that are not keeping the
DNS server responses in a local cache. This approach makes it
possible to distinguish between an issue coming from the user’s
workstation and one coming from the general function of the network.
Please note that hosts making a very high volume of DNS requests
may correspond to a malicious behaviour. For example, some malwares
try to establish connections to Internet by resolving domain names and
sometimes, the DNS protocol is used in cover channels to escape
information.
DNS errors issue
We can also ask for the top hosts receiving the most DNS error
messages (non-existing hosts, etc.). This will also shine a light on
misconfigured stations, generating an unnecessary traffic and lowering
the overall network performance.
DNS Internal misconfiguration
To do this, we need to identify the AXFR and IXFR
transactions’ autorithy server. If these updates occur too often (and
therefore, generate unnecessary traffic), we can conclude that there
is an issue. If the bandwidth used is too large, it means that our DNS
server requests a full zone transfer (AXFR) when an iterative
transfer (IXFR) would have been more adequate. If this is the
case, then the network administrator can take some easy steps to
improve his network’s performance.