Virtual Appliance Step-by-Step
How to get the image of the Virtual Appliance
You can get an image from the Internet at this link.
After clicking on Download and Install Free Trial, you should reach a subscription page with a form that needs to be filled.
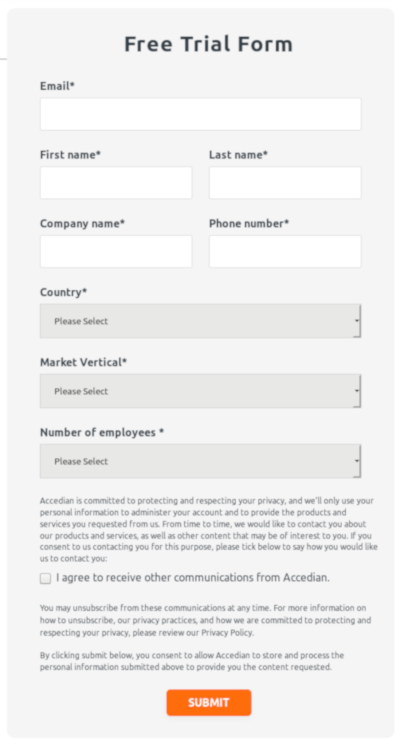
Once submitted, you will be redirected to a tutorial page.
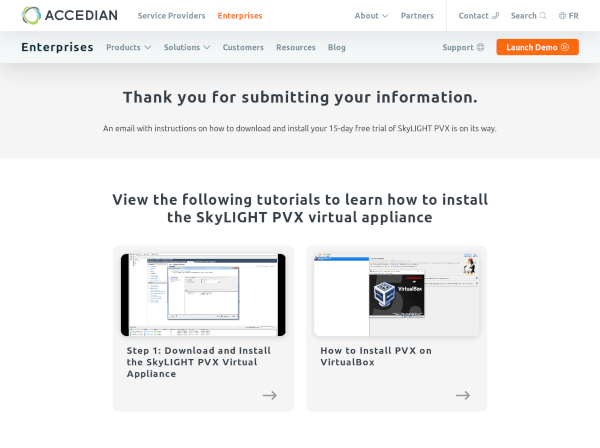
You will receive an email with the subject line Download SkyLIGHT PVX Virtual Appliance Free Trial.
Please follow the Download Link in the email.
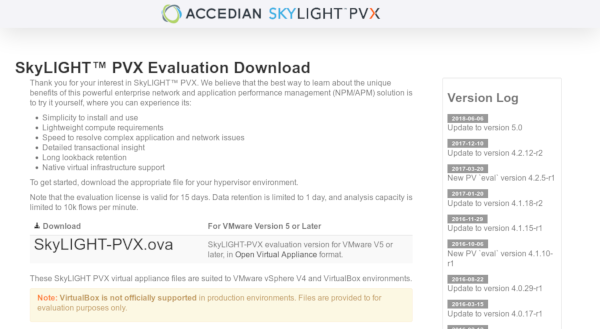
Download SkyLIGHT PVX.
Virtual Appliance Specifications
The SkyLIGHT PVX Virtual Appliance is designed to run in
VMware ESX/ESXi v4 (and later) environments.
In production environments, it is designed to run with a minimum
RAM of 8192MB, although a larger quantity is recommended to
ensure satisfactory performance rates.
We advise to allocate the following minimum resources:
- Trial
  - Virtual Datastore: >= 6GB RAM, 2 vCPUs

- Production:
  - Virtual Capture: >= 6GB, 2 vCPUs
  - Virtual Datastore: >= 8GB, 2 vCPUs
The specifications mentionned above are minimums, for very low traffic. For higher traffic, please refer to the Recommended Requirements section.
Installation
Connect to your vSphere Client.
In the Virtual Machines tab, in the “File” menu, select “Deploy a new OVF template”.
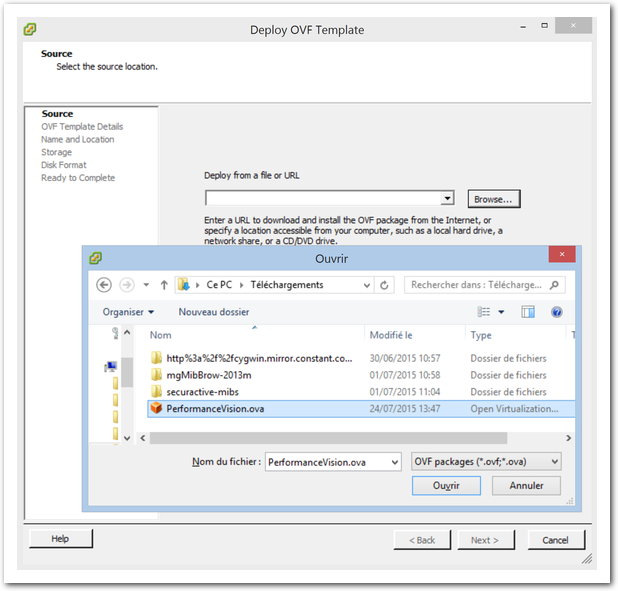
Find the SkyLIGHT PVX OVA file and click Open.
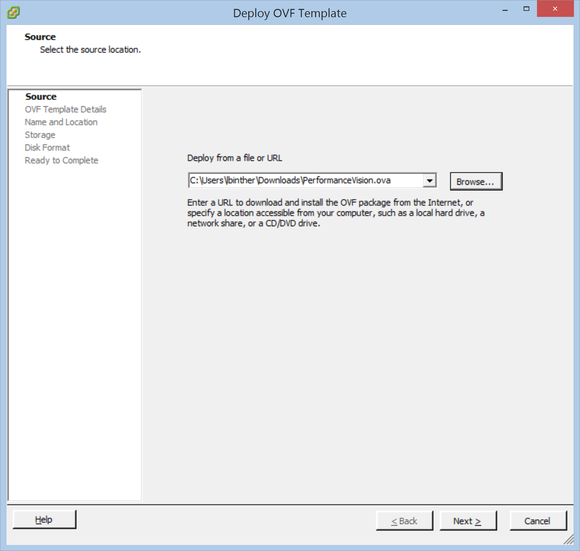
Click Next.
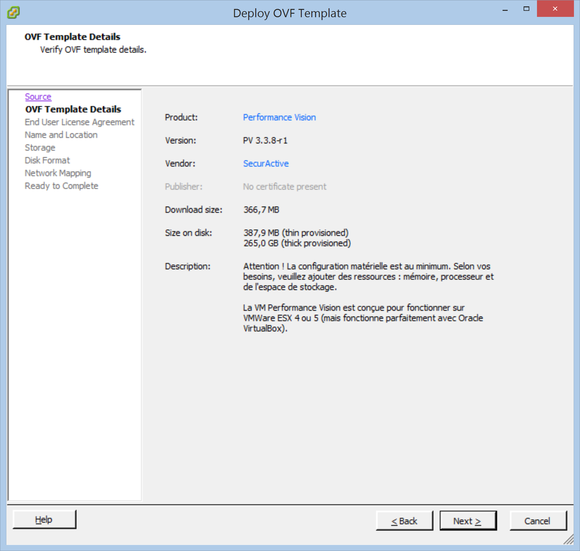
Click Next.
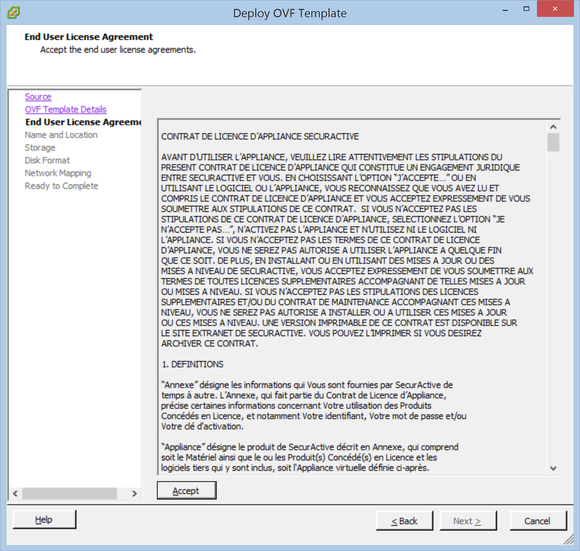
Read the license aggreement, then click Accept and Next.
Name the Virtual Machine appropriately and click Next.
Recommended Requirements
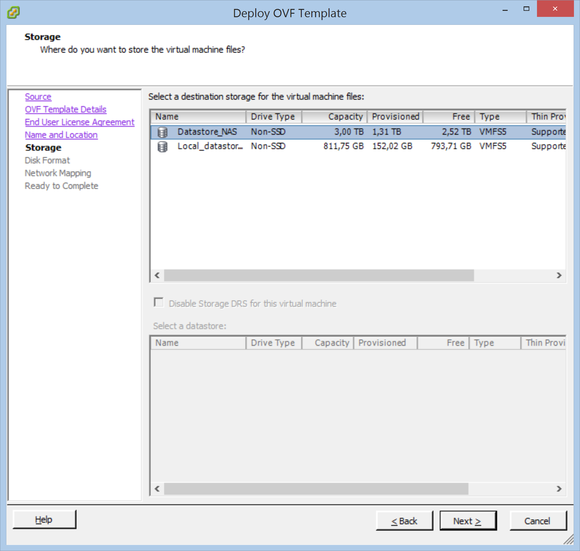
The system detects the space available on the disk for the new Virtual Machine.
We recommend to allocate the following resources:
- For the Trial version, the minimum is: 6GB of RAM and 2 vCPUs. These specifications are for very low traffic. If you want to test with more traffic, please refer to the resources requirements for production environments defined below.
- For Production environments, the following resources are recommended:
Virtual probe sizing for a Datastore
| Sizing / Hardware Equivalent | Expr/Site Small | Site Medium | Site Large | Site XLarge | DC Small | DC Medium | DC Large | DC XLarge | DC XXLarge |
| Flow analyses per min, max avg recommended | 20 K | 50 K | 100 K | 250 k | 500 K | 750 K | 1 M | 1.3 M | 1.6 M |
| CPU | 2.4 GHz, 2 Core / 4 Threads | 2.4 GHz, 4 Cores / 8 Threads | 2.4 GHz, 6 Cores / 12 Threads | 3.4 GHz, 6 Cores / 12 Threads | 3.2 GHz, 8 Cores / 16 Threads | 2.6 GHz, 12 Cores / 24 Threads | 2.6 GHz, 14 Cores / 28 Threads | 2.6 GHz, 14 Cores / 28 Threads | 2.6 GHz, 24 Cores / 48 Threads |
| RAM | 8 GB | 16 GB | 32 GB | 64 GB | 128 GB | 160 GB | 192 GB | 384 GB | 768 GB |
| System Disk(s) | 120 GB SSD | 120 GB SSD | 120 GB SSD | 120 GB SSD | 120 GB SSD | 120 GB SSD | 120 GB SSD | 120 GB SSD | 120 GB SSD |
| Data Disks | 500 GB SSD | 1 TB SSD | 2 TB SSD | 4 TB SSD | 6 TB SSD | 7 TB SSD | 8 TB SSD | 12 TB SSD | 15 TB SSD |
Virtual probe sizing for a Capture probe
| Sizing | Small | Medium | Large |
| Flow analyses per minute (max avg recommended) | 100 K | 1 M | 1.6 M |
| CPU | 2.4 GHz, 2 Cores / 4 Threads | 2.4 GHz, 6 Cores / 12 Threads | 2.4 GHz, 8 Cores / 16 Threads |
| RAM | 6 GB | 16 GB | 24 GB |
| Disk(s) | 30 GB | 40 GB | 50 GB |
| Data Disks | 50 MB/s | 80 MB/s | 100 MB/s |
| Input/Output Per Second | 500 IOPS | 1000 IOPS | 1000 IOPS |
Data disk specifications
Regarding storage, especially for production environments, data disk specifications are as follows:
| Data Disk Specifications | Enterprise SSD |
| Profile | Write Intensive |
| Sequential Read | 500 MB/s |
| Sequential Write | 450 MB/s |
| Random Read | 90 000 IOPS |
| Random Write | 25 000 IOPS |
| Total Byte Written | 12 000 TBW |
| Diskful Writes Per Day (5 years) | 3,5 DWPD |
We recommend using SSDs that are optimized for write-intensive applications.
We recommend that you use Thin Provision, as shown in the
following figure:
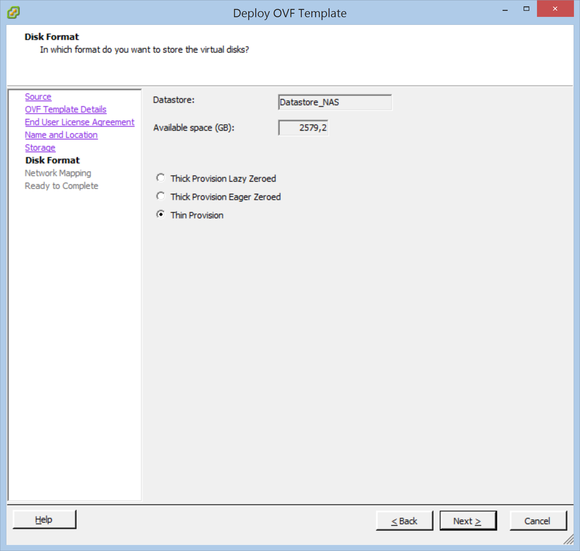
Disk configuration.
In case your hypervisor has NUMA nodes available, we also recommend that you
use a maximum of 2 virtual sockets depending on the virtual machine role, as
shown in the following figure.
SkyLIGHT PVX will try to effectively use the available NUMA nodes without hindering performance by binding the more demanding processes on specific NUMA nodes.
The basic recommendation depends on the role of your SkyLIGHT PVX appliance and is as follow:
- in case of a capture or a datastore without a local capture, we
recommend the use of only
1 virtual socketto force the number of NUMA nodes on the guest to only one. - in case of a datastore with a local capture, we recommend to use a
maximum of
2 virtual socketsto force the number of NUMA nodes on the guest to two.
RAM configuration of the virtual machine should also match the host’s amount of RAM per NUMA node.
However, keep in mind that having multiple virtual sockets may not hinder performance if your host does not have any NUMA configuration.
For more information, please refer to the following article from VMware describing the behavior of vNUMA: http://blogs.vmware.com/vsphere/2013/10/does-corespersocket-affect-performance.html
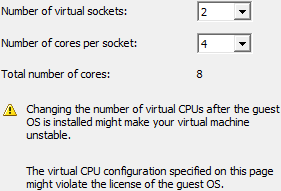
Optimal virtual sockets configuration for a 8 vCPU datastore with a local capture.
The Virtual Appliance installation will start.
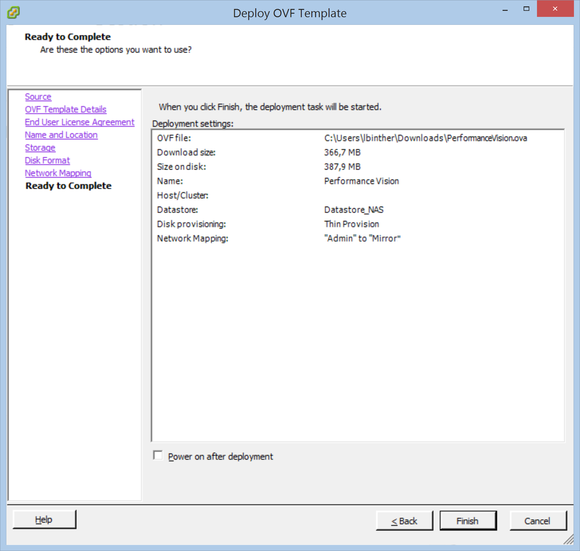
Click Finish.
You’ll get notified when the installation is complete.
Getting started
Once the Virtual Appliance is installed, you have to start it.
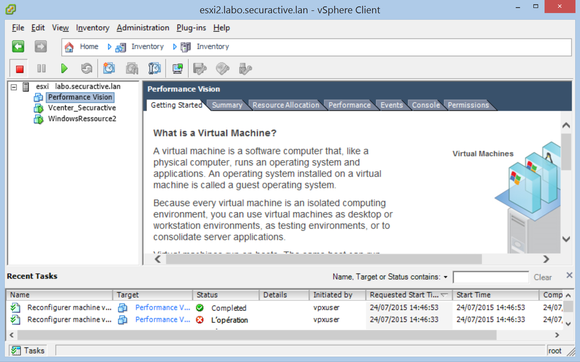
Click on “Power on the Virtual Machine” or the green triangle.
Access the virtual console
The probe is launched. When the network interfaces turn into promiscuous mode, click on the Console view and then “Enter” to display the login prompt.
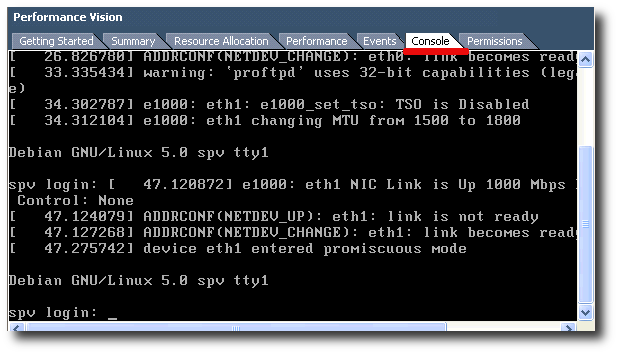
Console login prompt.
Note
Clicking on the black screen deactivates your mouse. To
reactivate it, you can use the key combination
Ctrl + Alt.
To know how to login and how the command line interface works, please
go to Pulsar. With Pulsar, you can configure your keyboard,
your timezone and other system settings like IP, DNS, NTP.
The summary view provided by vSphere displays the parameters such as IP addresses:
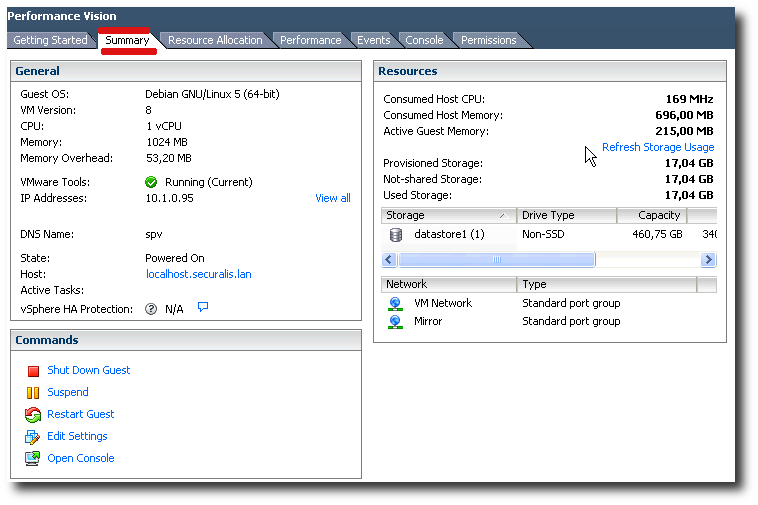
Summary view.
Note
The virtual machine has a second 150 GB hard disk that you can resize
depending on your needs, but then you’d have to format it (via Pulsar’s
format_data_disk command).
When your probe is set up, you have to reboot the Virtual Appliance.
Insert a license key
Except the evaluation version provided from our Web site, the virtual appliances are delivered without license. You normally receive this key via e-mail. If that is not the case, please contact us via our contact web page.
For more information about licensing and how to install the license, please go to Licensing and Upgrades.
Access the probe interface
To log into the web interface, please go to Access Through a Web browser.
Please go to Licensing and Upgrades to verify your license.
Traffic capture
First of all:
- The port mirroring should be activated on your switches (or TAP eventually).
- Connect the mirror destination port to the
ESXserver port dedicated for traffic capture.
We will now set the network in promiscuous mode.
In the following example, we are using an ESX server with 8
physical ports. It is necessary to add a virtual network for
traffic monitoring.
1. Connect to vSphere Client.
2. On your ESX server, go to the “Configuration” tab.
3. Click on the “Networking” Menu on the left column.
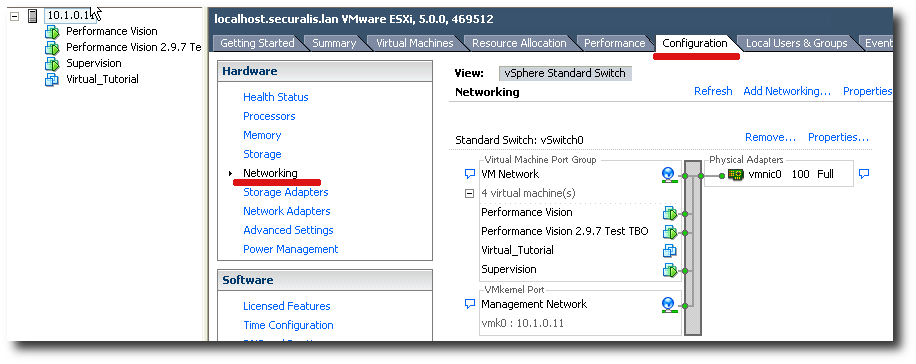
Networking Menu.
4. Click on “Add Networking”.
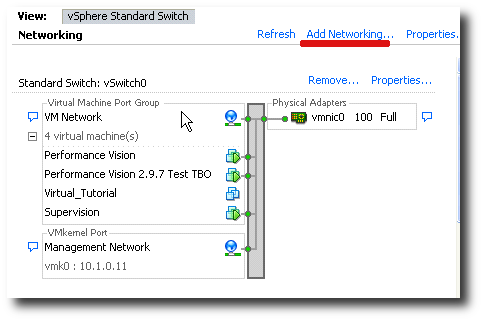
Add Networking.
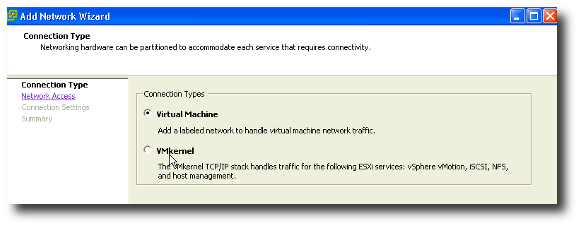
Select Virtual machine as Connection Types, then Click on “Next”.
Then, on the “Network Access” Menu, select the ESX physical port dedicated to traffic capture (here, it is vmnic3) and unselect the others. The ESX physical network will be bound to the new virtual network (here, it is VM Network2). Click on “Next”.
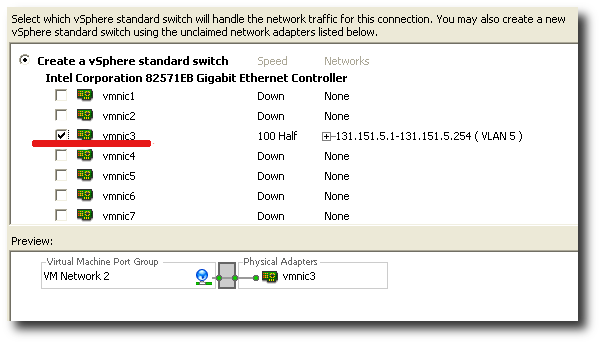
vSphere Switch.
We can customize the new network label as “Mirror” here.
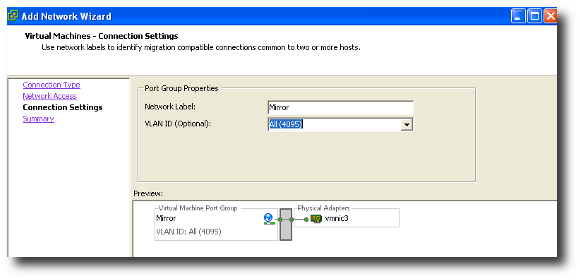
The following option allows VLAN tags.
VLAN ID (optional) for VLAN tags:
0   : Disables VLAN tagging on port group
4095: Enables VLAN tagging on port group
5. Then click on “Next” and “Finish” to complete the operation.
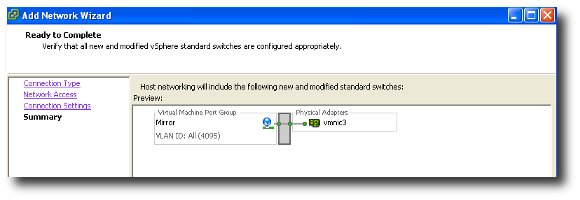
Networking Summary.
Set up promiscuous parameters
The ESX server now manages 2 virtual networks.
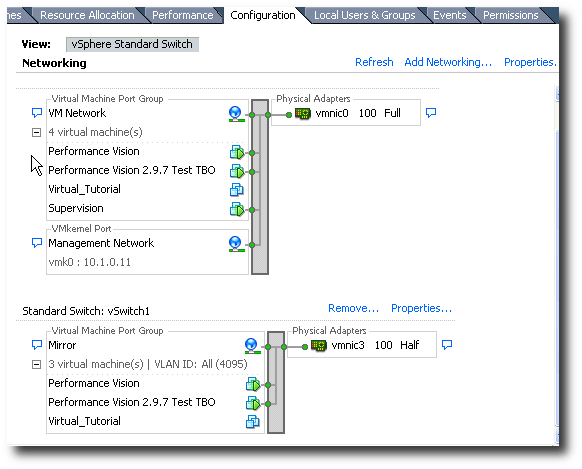
Two Virtual Networks.
The aim of the second vSwitch vSwitch1 is to show the flows in
promiscuous mode.
To set up promiscuous mode on the Mirror Network:
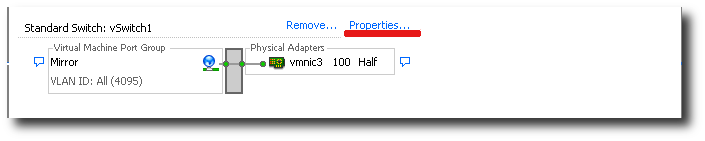
Click on « vSwitch1 Properties ».
In the “General” tab, edit the MTU settings to 9000.
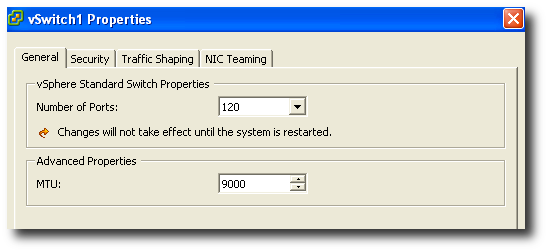
General settings: MTU.
Then in the “Security” tabs, select “Accept” from the promiscuous mode listbox.
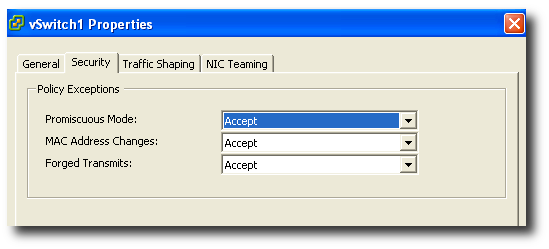
Security settings: accept promiscuous mode.
Add a listening network card to virtual appliance
Here, we should add a listening network port in promiscuous mode. Right-click the virtual appliance and choose “Edit settings”.
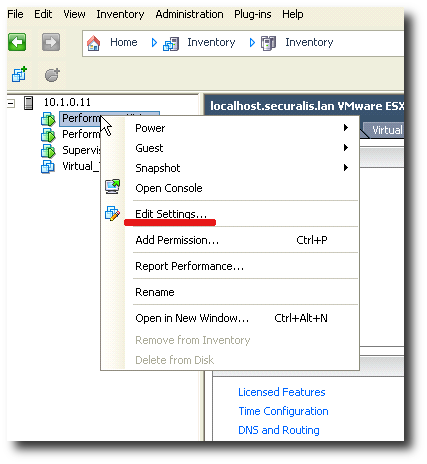
Click on Edit Settings.
In the Hardware tab, click on “Add”, then choose Ethernet adapter and click on “Next”. Attach the new Ethernet adapter to the network in promiscuous mode.
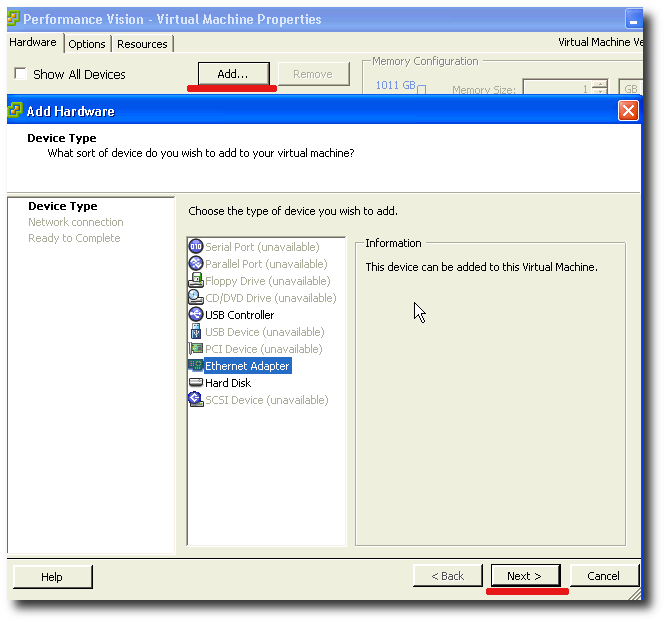
Attach Ethernet Adapter.
In the network connection listbox, choose the correct network configured above (Mirror here), then click on “Next”.
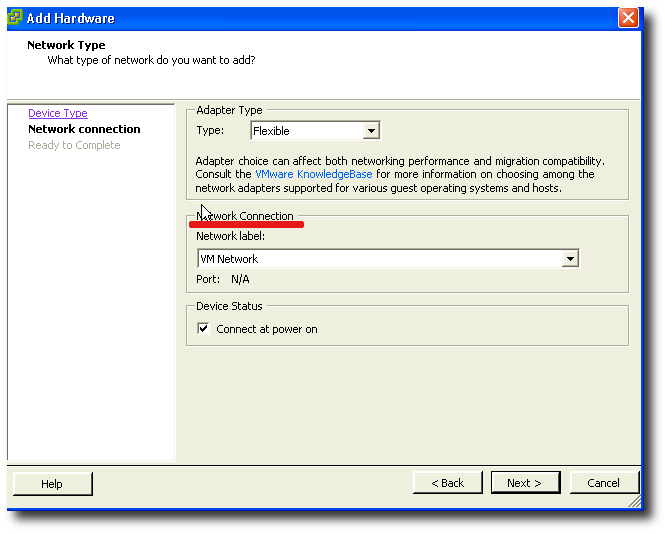
Network Connection.
Click on “Finish” to complete the operation.
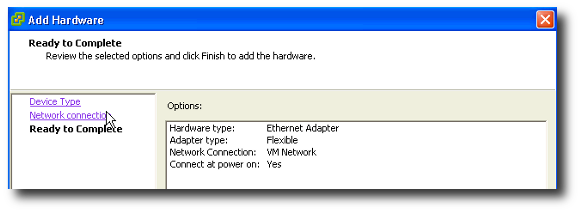
Ready to Complete.
Validate the Traffic Capture
You can power on the virtual appliance and validate traffic capture. There are 2 main ways to do so: with the graphical interface (GUI) or with Pulsar.
With the GUI, as an example, you can monitor the bandwidth after 6
minutes of listening by clicking on the Search button. See
Using the PVX Graphical Interface for more information.
With Pulsar, connect via SSH or from the virtual appliance console
on the ESX and type bmon. See Pulsar for more information
about the command line interface.
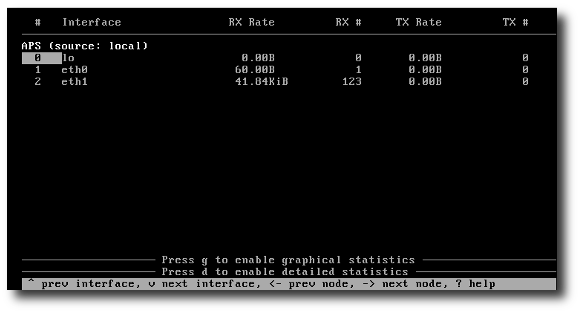
The ‘bmon’ command displays the traffic per interface.
How to use the product
The SkyLIGHT PVX Virtual Appliance is shipped with a default configuration that will likely not match your site very closely. For a better experience, it is recommended that you spend some time configuring some additional zones and applications to suit your traffic.
Here are the sections you should consult, in order:
- User Management for adding new users;
- Zone configuration for adding new zones or modifying the preset configuration;
- Application configuration for registering your specific applications;
- Business Critical Applications and/or Business Critical Networks to define your business critical applications/links;
- Reports to schedule periodic reports that will be sentvia email.
Eventualy, after reading the Using the PVX Graphical Interface and Interpreting the results sections, you will view your network differently.